The basis of comparison in this study is the examination of the number of Maine’s state government jobs relative to the number of jobs in the private sector as compared to the national average. Since the national average represents an amalgam of 50 states, one can reasonably assume that being above the national average indicates inefficiencies in the government workforce.
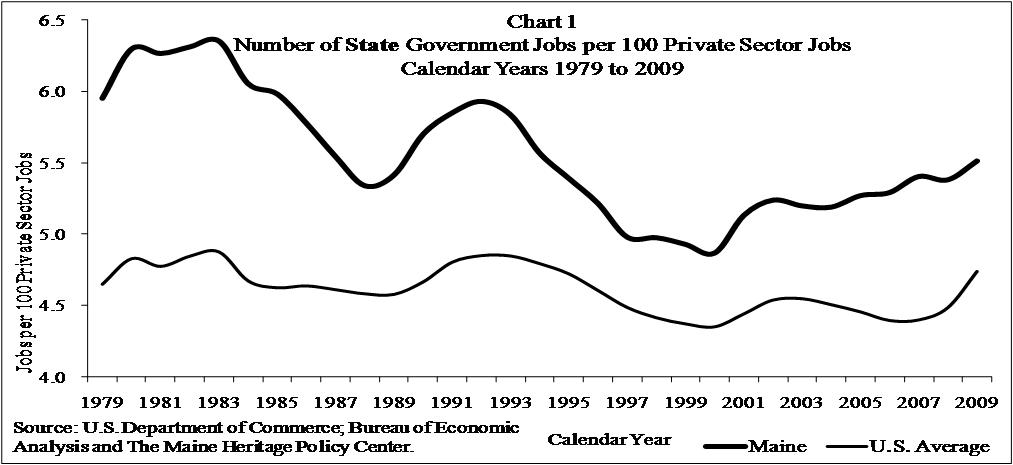
The first part of this study examines Maine’s state government employment levels using data from the Bureau of Economic Analysis. In 2009, Maine state government employed 5.51 people for every 100 people employed by the private sector—hereafter referred to as the “employment ratio.” Relative to the national average of 4.74, Maine’s state employment ratio is 16 percent higher and is the 21st-highest ratio in the country.
Right-sizing the state government workforce to the national average would reduce taxpayer-funded positions by up to 3,880 jobs, saving up to $185,635,011 annually. This is not a herculean task as Maine’s state workforce was nearly at that level in 2000, its lowest employment ratio ever achieved. Maine’s employment ratio has steadily and significantly increased ever since.
The second part of this study examines where over-employment exists by examining 32 major state government functions using data from the Census Bureau. Among the 32 functions, Maine’s higher employment ratio relative to the national average is concentrated in 3 of the functions that almost exactly account for the difference: Highways (5th highest in the country), Public Welfare (2nd highest in the country) and Higher Ed—Other (25th highest in the country).
Governor Lepage’s recent budget proposal only eliminates 81 positions—of which only 12 will involve layoffs. His plan achieves a modest savings of at least $4,385,294—just 2.4 percent of what he could have achieved if he right-sized Maine’s state workforce to the national average. Clearly there is room to do a lot more.
Additionally, this over-employment problem is a significant driver of Maine’s unfunded pension crisis which the Lepage Administration will also have to confront.[1] [2] In a forthcoming study, The Maine Heritage Policy Center will explore how right-sizing Maine’s state government workforces is a necessary step to solving the unfunded pension crisis.
The Size of Maine’s State Government Workforce
According to the U.S. Department of Commerce’s Bureau of Economic Analysis, in 2009, Maine’s state government employed 27,656 people (full and part time), or 4.7 percent of the total state labor force (public and private). Between 1979 and 2009, the number of state government employees has grown by 31 percent from 21,069 people to 27,656.
However, aggregate statistics are not very useful when it comes to informing public policy. Rather, policymakers need relative metrics to judge whether or not Maine has too many state government employees—in order to gauge their level of productivity. As such, this study explores the employment ratio of private versus public sector employment over time and across states.
State Government Employment Ratios
The employment ratio is derived by dividing state government employment by private employment. Chart 1 and Table 1 shows that in 2009 Maine’s state government employed 5.51 people for every 100 people employed by the private sector.
Table 1 also shows that when compared with the other 49 states, Maine has the 21st-highest state government employment ratio in the country, up from the 24th spot in 1970. In addition, Maine’s state government employment ratio is 16 percent higher than the national average—5.51 versus 4.74 nationally.
Regionally, Maine’s rank is higher than nearly all neighboring states with only Vermont’s employment ratio of 6.45 (17th) being higher. The remaining four neighboring states all have lower ranks: Connecticut (5.33, 23rd), Massachusetts (4.38, 40th), New Hampshire (4.63, 36th) and Rhode Island (5.14, 28th).
Budget Savings
As shown in Chart 2, in 2009, adjusting Maine’s state government employment ratio to the national average would have saved taxpayers up to $185,635,011. The budget savings are lower in 2009 than they would have been in 2007 at $234,206,891 only because the growth in state government employment nationally, between 2007 and 2009, surpassed the growth in Maine’s employment ratio. As shown in Chart 1, the number of Maine’s taxpayer-funded state government positions has significantly spiked since 2000.
Employment Ratios by Function
The data shown in Table 2 is from the U.S. Census Bureau and yields a slightly higher state government employment ratio for Maine than the data from the Bureau of Economic Analysis (5.59 versus 5.51). The national employment ratio, however, is lower (4.65 versus 4.74). Overall, this data implies a higher level of budget savings.
The employment ratios shown in Table 2 are also calculated by dividing the number of state government workers by the total number of private sector workers. Maine state government employs 5.59 workers for every 100 private sector workers, which exceeds the national average of 4.65 workers by 20.2 percent.
Among the 32 functions, Maine’s employment ratio is among the highest in the country for the following functions:
- Financial Administration (6th): Includes officials and central staff agencies concerned with tax assessment and collection, accounting, auditing, budgeting, purchasing, custody of funds, and other finance activities.
- Other Government Administration (12th): Includes administrative functions not included in financial, social insurance, judicial and legal administration.
- Highways (5th): Includes the maintenance, operation, repair, and construction of highways, streets, roads, alleys, sidewalks, bridges, tunnels, ferry boats, and related structures, including those operated on a toll basis.
- Public Welfare (2nd): Includes employees engaged in all public welfare activities, including the administration of public assistance and providing direct assistance such as Medicaid and TANF cash assistance (Temporary Assistance to Needy Families).
- Natural Resources (12th): Includes the conservation, promotion, and development of natural resources (soil, water, energy, minerals, etc.) and the regulation of industries which develop, utilize, or affect natural resources.
- Other and Unallocable (12th): Includes employees engaged in activities that are not applicable to other employment functions or are multifunctional such as voter registration and elections, economic development and code enforcement.
While “Higher Ed—Other,” which include all non-instructional employees, does not fall into the highest rankings in the country (25th); the absolute difference between the national average and Maine is one of the largest of all functions at 0.26. Combined with the difference found in Highways (0.26) and Public Welfare (0.40) nearly the entire difference with the national average is explained.
Employment Changes by Function
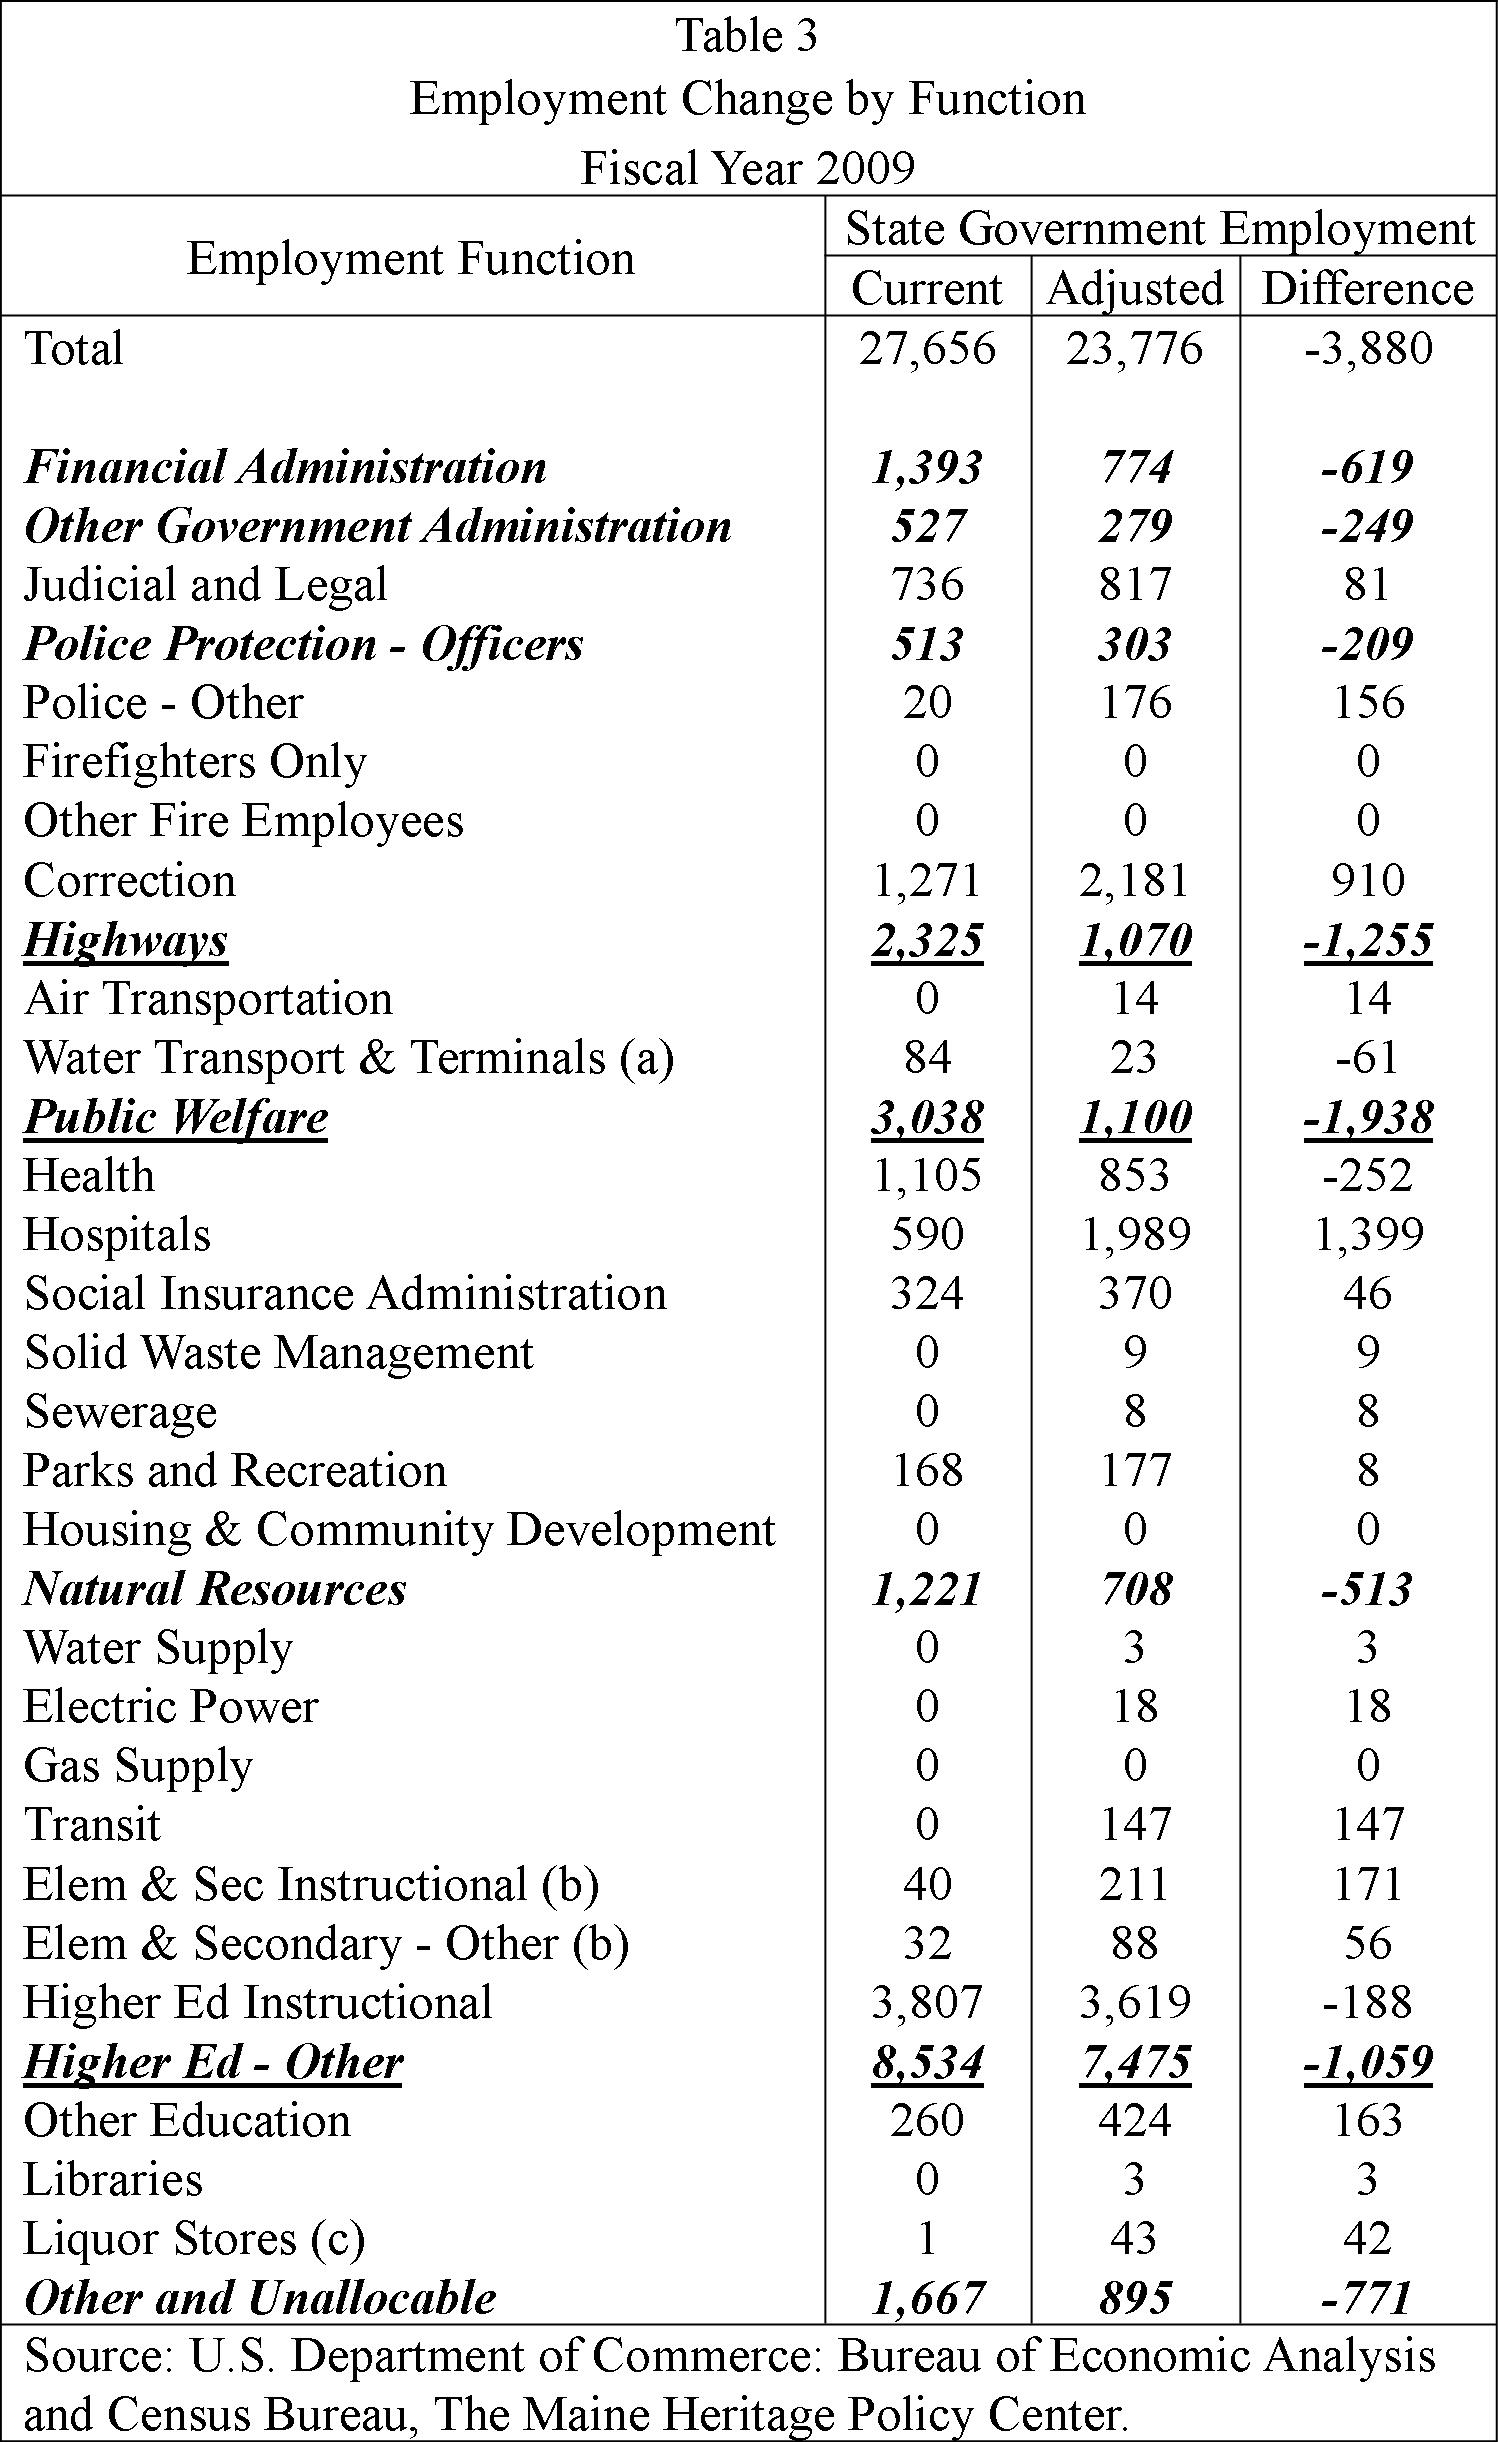
Table 3 transforms the employment ratios in Table 2 into actual employment levels. The total employment numbers are taken from the BEA data discussed previously which found that Maine’s state government workforce has approximately 3,880 too many employees.
By focusing on just the three functions with the largest absolute employment problem—”Highways,” “Public Welfare” and “Higher Ed—Other”—the state government workforce could be more than right-sized. In fact, right-sizing those three areas would eliminate 4,252 positions, which is significantly more than the required 3,880 necessary to achieve the national average.
Of course, there are other areas of significant over-employment that could be trimmed as well such as “Other and Unallocable” (771 positions), “Financial Administration” (619 positions) and “Natural Resources” (513 positions).
Conclusion
Overall, the one state government function that accounts for half of Maine’s over-employment problem is Public Welfare. Public welfare includes programs that directly aid individuals such as Medicaid and TANF cash assistance. This is not entirely surprising given that previous research has also pointed out that Maine has the most expensive Medicaid program in the country.[3]
Gov. Lepage’s recent budget proposal only eliminates 81 positions—of which only 12 will involve lay-offs—likely saving approximately $4,385,294. This falls far shorter than the nearly $186 million to be saved by bringing Maine’s state government workforce in line with the national average. In a forthcoming study, The Maine Heritage Policy Center will explore how right-sizing Maine’s state government workforce is a necessary step to solving the unfunded pension crisis.
Notes and Sources
[1] J. Scott Moody, “More Bonds? Not with Maine’s Ballooning Unfunded Retiree Liabilities,” Path to Prosperity, Issue 17, May 18, 2010. http://maine.thelibertylab.com/wp-content/uploads/More-Bonds-Not-with-Maines-Ballooning-Unfunded-Retiree-Liabilities.pdf
[2] J. Scott Moody, “The Cost of Doing Nothing: Maine’s Pension Payments are Crowding Out Other Spending,” Path to Prosperity, February 3, 2011. http://www.mainepolicy.org/wp-content/uploads/Path-to-Prosperity-The-Cost-of-Doing-Nothing.pdf
[3] Tarren Bragdon, “Maine’s Choice: Have Medicaid Take Care of the Truly Vulnerable or Give Away Medicaid to the Middle Class,” Medicaid Watch, Vol. 5, Issue No. 1, February 25, 2008.


