Not a lot of people know this, but Maine was one of only two states that never voted for Franklin Roosevelt.
For nearly a century and a half, ours was a state that was dominated by the Republican Party, with many years seeing state elections so one-sided that not a single member of the Democratic Party won a seat in the state Senate.
As the country started to shift politically, that started to change in the 1950s and Maine started to slide toward the Democratic party. By the 1970s, it was clear that the old loyalties had shifted and the state was a blue-leaning state. Yet even as that happened, as late as 2002 Republicans were routinely winning elections in Cumberland County, and Democrats were winning in northern Maine.
And of course, politics in our state is shifting again, and it is still not really clear how that will settle out.
I spent most of my adult life being fascinated by Maine politics and its history. But trying to get a handle on what that history really looked like, and what it means, was incredibly difficult.
Not anymore.
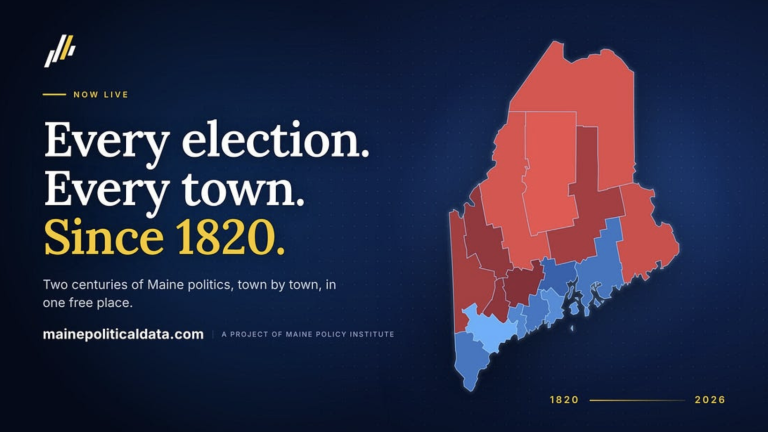
Today we’re announcing the release of Maine Political Data, a project of the Maine Policy Institute that seeks to put in one place all of the information we can collect about Maine, its political culture, and its history.
Here is the thing about Maine’s political record. All of it exists. The Secretary of State has tabulated every election since statehood. The returns are in the State Archives, in the Law Library, in the old Maine Registers, in boxes of handwritten ledgers and in spreadsheets with names like governorgen.xlsx. What has never existed is a place where researchers, journalists or a normal person could go and simply look it up.
I would like to give you the tour of this powerful new tool.
Start With Your Own Town
Every one of Maine’s 504 towns, cities, and plantations has its own page. So does every county, every State House and Senate district, both congressional districts, and twelve regions of the state that we think are geographically and culturally distinct.
I live in Yarmouth, so let me start there. Yarmouth’s page will tell you that it has 6,703 active voters, that 50.8 percent of them are Democrats and 17.9 percent are Republicans, and that Kamala Harris carried it 76.4 to 21.8. It ranks 15th most Democratic of the 504 towns. I knew most of that already, mostly from experience, but it is a different thing to see it on one screen with the receipts attached.
It is also interesting to note how my town has changed. As late as 2007 there were more Republicans in Yarmouth than there were Democrats.
Now let’s go somewhere more interesting. I grew up in Hampden, just south of Bangor, and Hampden’s page is a better advertisement for the site than my current address, because Hampden is the kind of town that fools people.
Look at the voter rolls and you would call it a Republican town. Nearly 38 percent of its 5,421 active voters are Republicans and 29 percent are Democrats, with another 29 percent enrolled in no party at all. Look at the results and you would not. Kamala Harris carried it, barely, 49.6 to 48.3. Janet Mills carried it, barely, 50 to 48.6. Angus King won it by twelve. In a neutral year, the site rates Hampden a few points Republican. On the ballot lately, it has been a coin flip. Both things are true, and now you can see both.

The top of each page carries three figures. The first is the one I care most about, so I will spend a minute on it.
Maine, Under the Hood
Maine has voted about ten points Democratic at the top of the ticket in recent elections. That is a fact, and it is also a little misleading, because a lot of it is weather. Who the candidates were. What the national mood was. Whether it was a midterm with an unpopular president or a presidential year with a Maine senator on the ballot who refuses to join a party.
What I wanted was something closer to the idea behind the Cook Partisan Voting Index, which rates congressional districts by how they vote relative to the country, computed for every town in Maine. But I wanted our metric to describe what an area would do if you stripped out the climate and the candidates, rather than simply describing how much more or less partisan an area is compared to the state. What would this place do in a neutral year with two evenly matched nominees?
That number is the Partisan Electoral Alignment Index, or Partisan EAI, and the statewide answer is D+4.8. Not ten. Five.

The method is simple enough to explain in a paragraph, and the Methodology page explains it in several. Maine’s own lean relative to the country, averaged over the last three presidential elections, is D+4.8. Each town’s lean is then measured against Maine’s in the recent top-of-ticket races, weighted toward the most recent cycle, with U.S. House races adjusted so that a town in the Second District is not penalized for living in the Second District. Add the two and you have the town’s expected margin in a neutral year. No model, no simulation, no black box. Arithmetic you can check.
Do that for all 504 towns and the state looks like this: 288 are safe Republican, 65 lean Republican, 51 are true battlegrounds, 25 lean Democratic, and 75 are safe Democratic.

Read that again if you need to. Maine’s Democratic margins on election night come from a relatively small number of large, very blue places. Cumberland County alone sits at D+33. Most of the map leans the other way, and in much of it the lean is not close.

Next to the Partisan EAI, each page shows the Partisan Edge, which is simply the Democratic margin over Republicans on the current voter rolls (statewide, D+5.5 as of March), and 2024 turnout, the share of active voters who actually showed up last November (statewide, 78.9 percent). Put the three together and you can tell in about four seconds whether a town is a place where campaigns persuade or a place where they turn out, which, if you have ever run one, is the only question that matters.
If you want the whole table rather than one town at a time, it is downloadable, every town, county and district, with the races behind each number.
Two Hundred Years
Now the part that took the longest, and the part I am proudest of.
The state’s modern election files begin in 1990. Before that, the record is paper. The Law Library has scanned canvasses for most of the postwar decades. The State Archives has digitized nearly 600 Secretary of State tabulation books running from the 1830s to 1984, including a bound abstract of the gubernatorial returns for every political year from 1832 to 1840, written in a clerk’s hand. The old Maine Registers printed town-by-town returns for governor from 1868 on. For the very early years, before the state’s own books survive, there are the county tallies in Michael Dubin’s reference volumes.
We transcribed them. All of them. Every town figure was checked against the printed county total, and where a clerk’s arithmetic did not add up, which happened more than you would think, the town figures won and the discrepancy was logged. The result is that every governor’s race in Maine is on the site town by town from 1868 forward, with one gap in 1879, and the record for the office runs all the way back to William King in 1820.

A few other doors worth opening:
- Every governor of Maine, in order, by party, with portraits, and a results map for every governor’s race on file.
- All 132 Maine Legislatures, seat by seat, with the party balance of each chamber charted from 1820 to today. The first eight Legislatures are labelled what they were, a one-party Democratic-Republican era, which should not be confused with either of today’s parties no matter how tempting.
- A page for every person who has held or sought office in Maine since statehood. There are more than 20,000 of them. Offices held, every election contested, where the votes came from. If your great-grandfather served a term in the House in 1911, he is in there.
- Every U.S. senator and representative Maine has sent to Washington, and every justice of the Supreme Judicial Court with the governor who appointed them.
- Party registration for every town going back to the 1950s, including a run of 1970s and 1980s reports the state itself no longer had in one place. The Maine State Library found two of them for us this month.
The Pages the Insiders Will Keep Open
Two more sections, built for the people who will be refreshing them until November 3.
Campaign Finance pulls every report filed with the FEC and the Maine Ethics Commission for this year’s U.S. Senate, U.S. House and legislative races into one place: raised, spent, cash on hand, outside spending, and how the parties stack up chamber by chamber. The history runs back to 1980. New reports are folded in as they are filed.
Historical Polling is the one I expect to get the most angry email about. We collected nearly 700 polls of Maine races going back decades and set each one beside the result it tried to predict. Every poll in a race is plotted against the final margin, and each pollster’s record in Maine is there for anyone to see. Before you share the next poll, look up who conducted it.

How it was Built, and What to do When We Got Something Wrong
I want to be candid about two things, because the site is built on the premise that we show our work.
First, the method. Every figure on every page traces to a public record, and the Data Sources page lists all of them, down to the individual canvass book. Every rating is written out in full. The data is published under a Creative Commons license, which means you can take it, use it, and build on it, as long as you say where it came from.
Second, the labor. A project of this size would have taken a small staff several years not long ago. We did it in months because AI tools helped us with the transcription, the data processing and page construction, under our direction, with our staff checking the output against the original records. I designed it and I am responsible for it. I think the honest thing is to say so plainly rather than let anyone imagine a room full of graduate students.
Which brings me to the inevitable. Somewhere in two million data points there are probably mistakes. A digit a clerk transposed in 1902 that we faithfully copied. A town the Secretary of State listed in the wrong county in 1995. When you find one, and you almost certainly will, every page has a link to the Contact page. Tell us what is wrong and what the source says. We will fix it, note the correction on the page, and thank you for it. That is how a public record is supposed to work.
Why Bother
I run a think tank, and there is one thing more important than anything else to an organization like Maine Policy Institute: information. While we of course engage in research and analysis, and even recommendations, we need to understand reality to judge anything, and only unbiased, data-centric information can give it to us.
You will note that there is no commentary anywhere on the site, no editorial about what the numbers mean, no suggestion about what you should do with them. That was deliberate, and it the single most important fact about what we’ve built here. This is about presenting Maine and its political culture and history to you as it is, and allowing you to make your own interpretations.
We built this because I have come to believe that the most valuable thing an organization like ours can do is lower the cost of knowing things. Maine’s politics is more interesting, more varied and more local than its statewide results suggest. For two hundred years the evidence for that has been scattered across a dozen buildings in Augusta. Now it is in one place, free, for anyone who wants it.
And this project is the beginning of many more projects like it which will similarly lower the cost of knowing things. Things about the state budget, education, housing and energy. All on the horizon, and all now possible.
As for now, go look up your town. Then look up the town you grew up in. Then look up the one your in-laws live in, and learn more about the Maine we all love.