
Variable-by-Variable Analysis
A. Graduation Rate
The four-year graduation rate is one of the standards used for evaluating charter schools. Charter schools are considered to be meeting expectations if they have a graduation rate of 87% or higher. Approaching expectations is defined as being within 5% below the target, which equates to rates between 82% and 87%. Lastly, failing expectations is when the school has a graduation rate of 82% or less. The sample size for this section is smaller than most others at 99 schools overall, since only schools serving grade 12 report four-year graduation rates.

Figure A-1 summarizes our findings regarding the four-year graduation rate. Charter schools in Maine, on average, do better than the noncharter public schools. Four of the seven (57.14%) charter high schools have better graduation rates than 75% of the noncharter public high schools. Moreover, the median charter school graduation rate is 92.65%, compared to 86.36% for noncharter public schools.
If the same graduation rate standard for charter schools were applied to noncharter public high schools, 29 would outright fail expectations, or 29.29%. For charter schools, only the Maine Academy of Natural Sciences failed to meet expectations. Put differently, 14.29% of charter schools serving grade 12 failed expectations in this category (one-in- seven). Twenty-three noncharter public high schools would be approaching expectations, or 23.23%, while not one charter school is labelled as approaching expectations. Additionally, 52.53% of noncharter public high schools would be considered below “meeting expectations” in the four-year graduation rate standard, whereas only two of the seven charter schools (28.57%) would be considered as not “meeting expectations.”
It is worth noting that the small sample size for charter schools in this standard impacts the significance of this comparison, but it remains the case that a majority of noncharter public high schools would not be meeting expectations if the four-year graduation rate standard for charter schools was applied to them.
B. Academic Performance
In Maine, the academic performance of noncharters and charter schools is evaluated across three subject areas: English Language Arts, Math, and Science. The test for English Language Arts and Math is given annually to students in grades 3-8 and to students in their second year of high school. This test assesses students on the Common Core State Standards. The test for Science is taken annually by students in grades five, eight, and by those in their third year of high school, and it assesses students based on the Next Generation Science Standards. It should be noted that students with significant disabilities may qualify to take an alternate assessment in each of these subject areas.
In the 2023-2024 Annual Report to the Commissioner, the academic performance of each charter school by subject was evaluated by comparing the percentage of students at or above expectations at that school to the statewide average, to which the thresholds can be seen below.

As previously mentioned, only Math and English Language Arts are used as standards by the Commission. The statewide average for students at or above achievement level was 65.4% for English Language Arts and 47.2% for Math. Based on the above outline, schools more than 15% below the state average are failing expectations for an academic category. Therefore, the threshold for a school to be failing expectations would be less than 50.4% of students at or above state expectations for English Language Arts and less than 32.2% for Math.
Based on the threshold, 55 of 502 (10.96%) noncharter public schools with English Language Arts data would be considered to be failing English Language Arts expectations. Additionally, 72 of 502 (14.34%) noncharter public schools with Math data would be considered to be failing Math standards. In contrast, only Dimensions Academy of Community Regional Charter School fails by the English Language Arts expectations, or 10% of charter schools. However, Maine Connections Academy, Maine Virtual Academy, and both Overman Academy and Dimensions Academy of Community Regional Charter School fail Math standards, or 40% of charter schools. Essentially, charter schools and noncharter public schools have a nearly identical proportion of failures under the English Language Arts standard, but a larger proportion of charter schools fail under Math standards.
For each subject assessed, we created dot plots based on the grade levels each school serves. Maine charter schools serve a range of grades, including PK–K, PK–06, PK–08, K–08, 06–12, 07–12, and 09–12.
Because standardized testing in these subjects begins in third grade, we grouped schools serving grades 3–6 together—even if they also serve students below third grade—as long as they do not serve any grades above sixth. We applied the same logic to group schools serving grades 3–8.
One charter school, Creative Children’s Academy, serves only PK–K. Since it does not enroll students in tested grades, it does not report data for this analysis.
Math Performance

Figure B-1 represents the percentage of students below state expectations in Math from 3-6 charter schools serving grades 3-6 and noncharter public schools serving the same grade level. Acadia Academy was the one charter school applicable, which saw 64.29% of its students below state expectations. This was higher than the noncharter public school average (mean) of 53.71%, as well as the median for noncharter public schools of 55.12%. It is important to remember that for these standards, a higher percentage is worse, as it is a measure of the percent of students below state expectations.
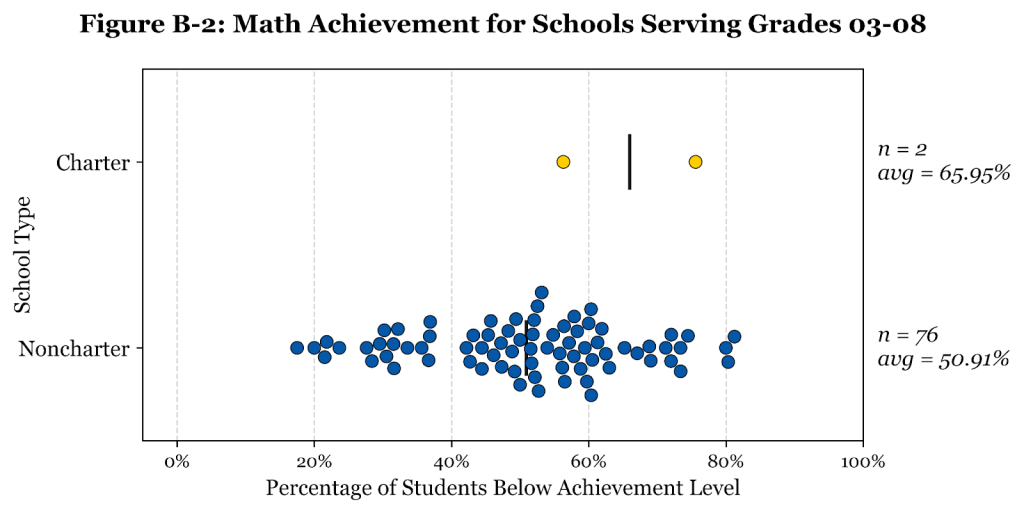
Figure B-2 portrays the percentage of students below state expectations in Math from charter schools serving grades 3-8 and noncharter public schools serving the same grade levels. Dimensions Academy from Community Regional Charter School and Fiddlehead School of Arts & Science were the two 3-8 charter schools, which had a mean and median of 65.95% of its students below state expectations. This was again higher than the noncharter public school average of 50.91% and the median of 52.11% of students below state expectations for Math.

Figure B-3 demonstrates the percentage of students below state expectations in Math from charter schools serving grades 6-12 and noncharter public schools serving the same grade levels. Overman Academy of Community Regional Charter School was the only charter school serving grades 6-12, which had 86.57% of its students below state expectations. On the contrary, noncharter public schools had a lower mean percentage of students below state expectations of 60.08%, and a lower median of 61.82%.
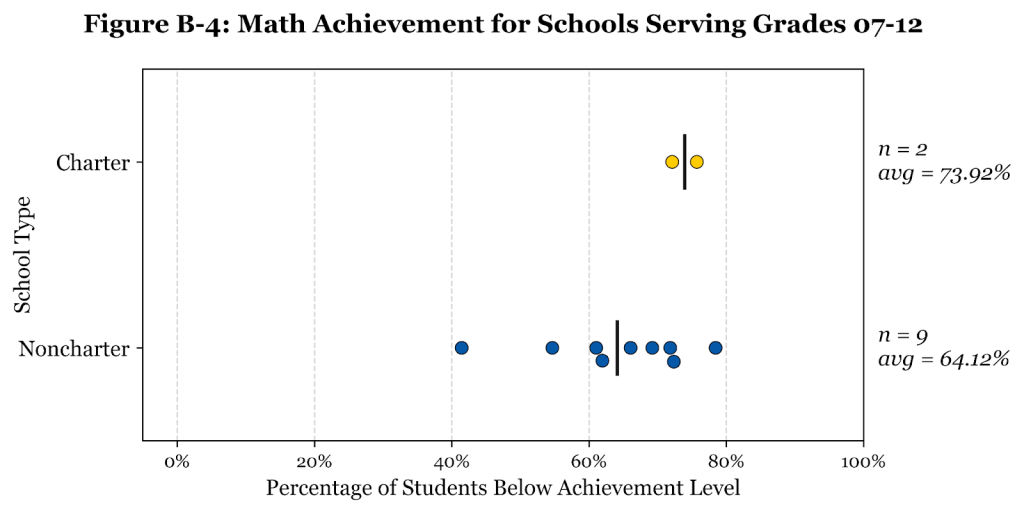
Figure B-4 illustrates the percentage of students below state expectations in Math from charter schools serving grades 7-12 and noncharter public schools serving the same grade levels. Maine Connections Academy and Maine Virtual Academy were the two charter schools serving grades 7-12, which had a mean and median of 73.92% of students below state expectations. On the contrary, noncharter public schools serving grades 7-12 had a lower mean percentage of students below state expectations of 64.12%, and a lower median of 66.07%.
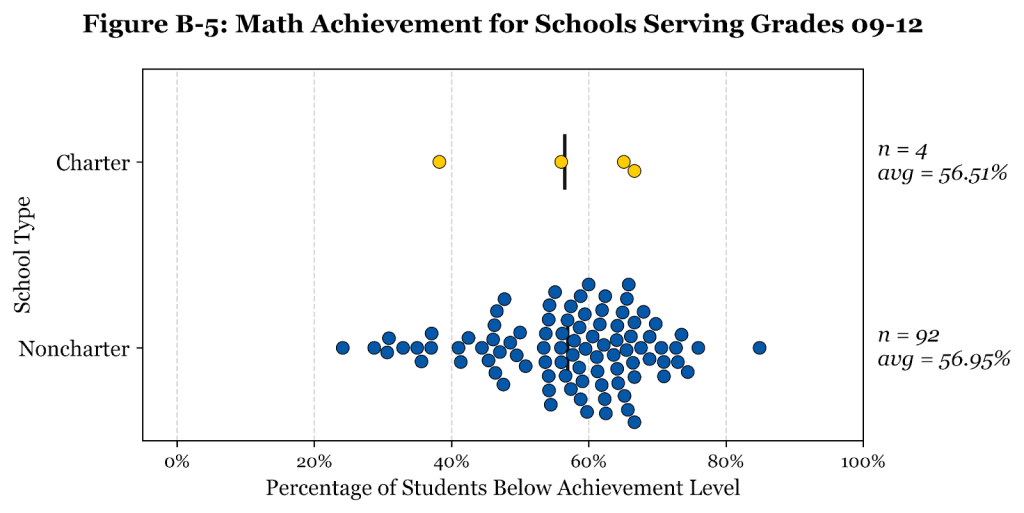
Figure B-5 displays the percentage of students below state expectations in Math from charter schools serving grades 9-12 and noncharter public schools serving the same grade levels. Baxter Academy for Tech & Sciences, Ecology Learning Center, Maine Academy of Natural Sciences, and Maine Arts Academy School were the four grades 9-12 charter schools represented. They had a mean percentage of students below state expectations of 56.51% and a median of 60.56%. Noncharter public schools serving grades 9-12 had a mean percentage of students below state expectations of 56.95%, but a lower median of 58.82%.

Figure B-6 shows the percentage of students below achievement level in Math of all charter schools and noncharter public schools which reported data. Contrary to English Language Arts and Science performance, noncharter public schools clearly outperform charter schools in Math. The median percentage of students below state expectations for noncharter public schools was 52.46% while the median for charter schools was 65.90%, a difference of 13.44%. Additionally, charter schools had a 15% higher mean than noncharter public schools (65.66% vs. 50.83%).
In essence, charter schools performed worse than noncharter public schools in Math standards. However, for schools serving grades 9-12, charter schools had the same mean of 57% as noncharter public schools. Additionally, the median for charter schools serving grades 9-12 was only 3.56% greater than noncharter public schools serving the same grades. Charter schools performed the worst in the grades 6-12 category, where the lone charter school was 27% greater than the mean noncharter public school and 25.18% greater than the median noncharter public school.
English Language Arts Performance
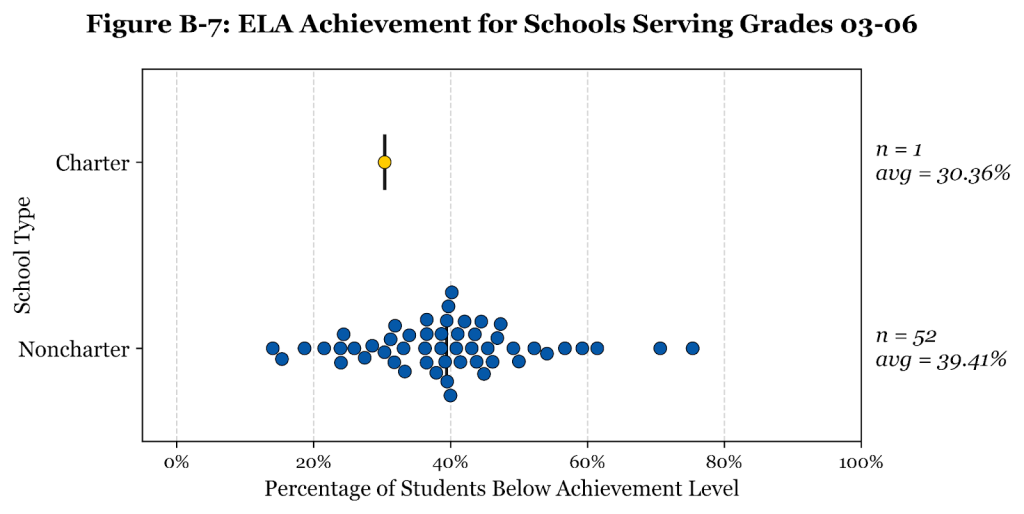
Figure B-7 shows the percentage of students below state expectations in English Language Arts from charter schools serving grades 3-6 and noncharter public schools serving the same grades. Acadia Academy was the one charter school applicable, which saw 30.36% of its students below state expectations. This was lower than the noncharter public school mean of 39.41%, as well as the median for noncharter public schools of 39.52%. Since these charts measure the percent below state standards for each school, a lower number is better.
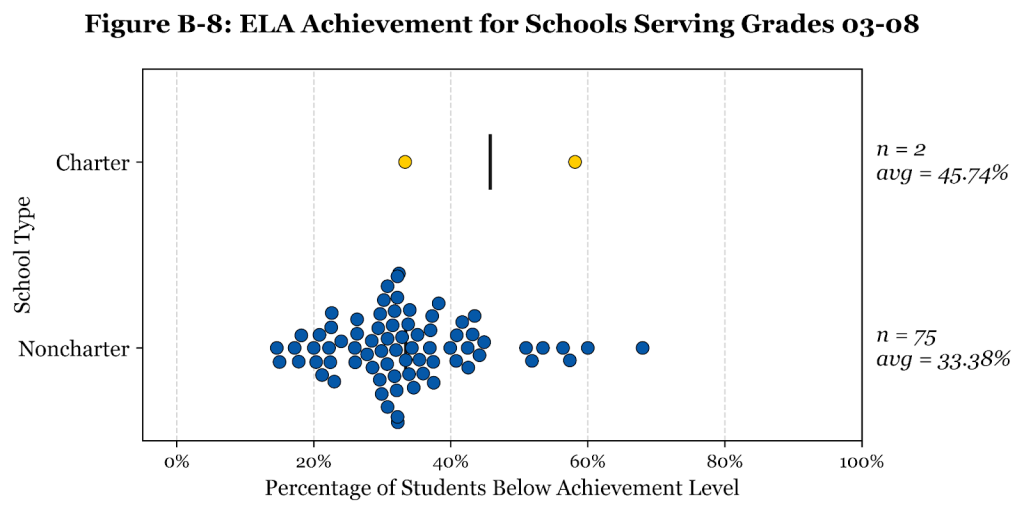
Figure B-8 presents the percentage of students below state expectations in English Language Arts from charter schools serving grades 3-8 and noncharter public schools serving the same grades. Dimensions Academy from Community Regional Charter School and Fiddlehead School of Arts & Science are the two charter schools represented, which had a mean and median of 45.74% of its students below state expectations. This was higher than the noncharter public school mean of 33.38% and the median of 32.2% of students below state expectations for English Language Arts.

Figure B-9 represents the percentage of students below state expectations in English Language Arts from charters serving grades 6-12 and noncharter public schools serving the same grades. Overman Academy of Community Regional Charter School was the only charter school serving grades 6-12, which had 49.25% of its students below state expectations. On the contrary, noncharter public schools serving grades 9-12 had a lower mean percentage of students below state expectations of 31.23%, and a lower median of 30.54%.
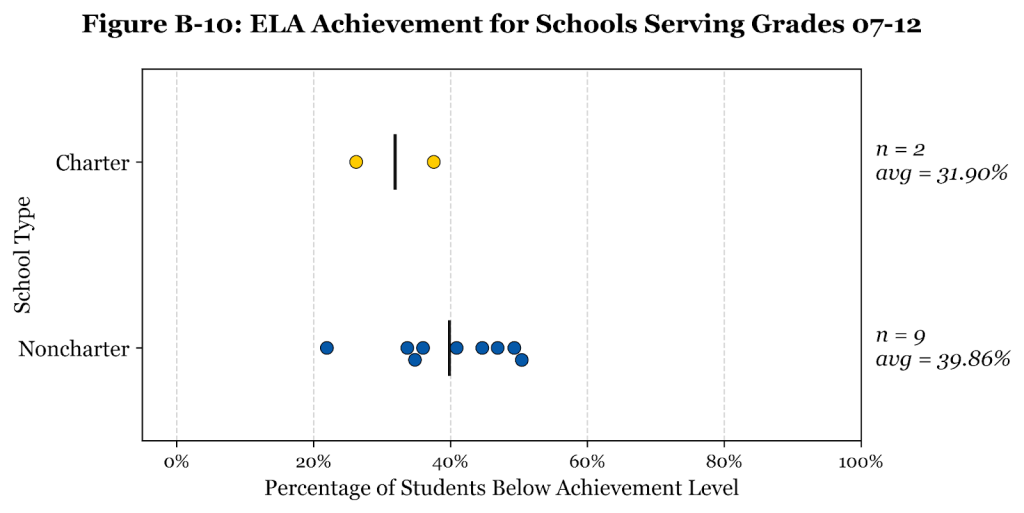
Figure B-10 contrasts the percentage of students below state expectations in English Language Arts from charter schools serving grades 7-12 and noncharter public schools serving the same grades. Maine Connections Academy and Maine Virtual Academy were the two charter schools serving these grades, which had a mean of 31.90% and median of 32% of its students below state expectations. Noncharter public schools serving grades 7-12 had a greater mean percentage of students below state expectations of 39.86%, and a greater median of 40.91%.

Figure B-11 reflects the percentage of students below state expectations in English Language Arts from charter schools serving grades 9-12 and noncharter public schools serving the same grades. Baxter Academy, Ecology Learning Center, Maine Academy of Natural Sciences, and Maine Arts Academy School were the four charter high schools represented. They had a mean percentage of students below state expectations of 26.10% and a median of 25.85%. Noncharter public schools serving grades 9-12 had a larger mean percentage of students below state expectations of 40.13% and a larger median of 38.63%.
Since almost half of the charter schools are within the 9-12 category, this last graph’s measure of the substantially lower failure rate shows that charter high school students do substantially better in English Language Arts. This is so substantial that across four charter schools, the average charter school has more than 10% more students meeting state standards than the average noncharter public school.

Figure B-12 illustrates the percentage of students below achievement level in English Language Arts for the 10 current Maine charter schools reporting data and the 502 noncharter public schools reporting data. Charter schools had a smaller mean of 33.93% compared to the 35.64% mean for noncharter public schools. Similarly, Charter schools had a median of 31.33%, lower than the median for noncharter public schools of 34.68%.
Overall, charter schools tended to outperform noncharter public schools on English Language Arts standards. Charter schools had lower percentages of students below state expectations for grades 3-6, 7-12, and 9-12 by 8% or more for each category. Charter schools performed worse in grades 3-8 and 6-12 comparatively by roughly 14% or more. Furthermore, charter schools had a 3.35% lower median in comparison to noncharter public schools in the overall English Language Arts data.
Science Performance
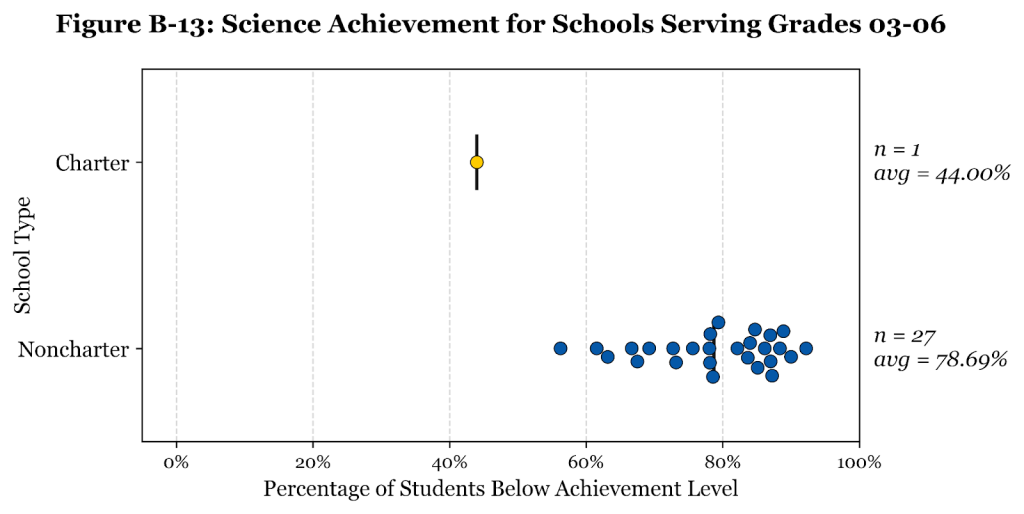
Figure B-13 portrays the percentage of students below state expectations in Science from charter schools serving grades 3-6 and noncharter public schools serving the same grades. Acadia Academy was the one charter school applicable, which saw 44.00% of its students below state expectations. This was lower than the noncharter public school average of 78.69%, as well as the median for noncharter public schools of 78.97%. While it is striking that Acadia Academy performed better than any other noncharter public school serving students at the same grade levels, Acadia is the only charter to which noncharters can be compared and may not be indicative of statewide trends among all charter schools.

Figure B-14 illustrates the percentage of students below state expectations in Science from charter schools serving grades 3-8 and noncharter public schools serving the same grades. Fiddlehead School of Arts and Science was the one charter school reporting data for this grade level, which saw 64.86% of its students below state expectations. This was one percent higher than the noncharter public school average of 63.71%, and less than one percent higher than the median for noncharter public schools serving grades 3-8 of 64.69%.

Figure B-15 presents the percentage of students below state expectations in Science from charter schools serving grades 6-12 and noncharter public schools serving the same grades. Overman Academy of Community Regional Charter School was the only charter school serving this grade level, which had 76.36% of its students below state expectations. Noncharter public schools serving grades 6-12 had a lower mean percentage of students below state expectations of 63.61%, and a lower median of 65.13%.

Figure B-16 shows the percentage of students below state expectations in Science from charter schools serving grades 7-12 and noncharter public schools serving the same grades. Maine Connections Academy and Maine Virtual Academy were the two charter schools serving grades 7-12, which had a mean and median of 62.28% of its students below state expectations. Meanwhile, noncharter public schools serving these grades had a larger mean percentage of students below state expectations of 69.24% and a larger median of 69.47%.
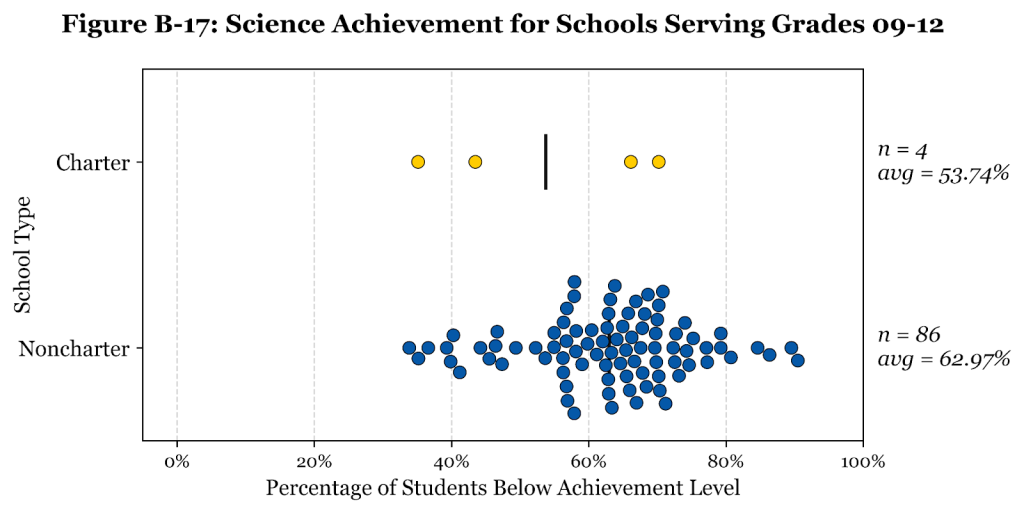
Figure B-17 demonstrates the percentage of students below state expectations in Science from charters serving grades 9-12 and noncharter public schools serving the same grades. Baxter Academy, Ecology Learning Center, Maine Academy of Natural Sciences, and Maine Arts Academy School are the four charter schools represented. They had a mean percentage of students below state expectations of 53.74% and a median of 54.82%. Noncharter public schools serving these grades had a higher mean percentage of students below state expectations of 62.97% and a higher median of 63.96%.
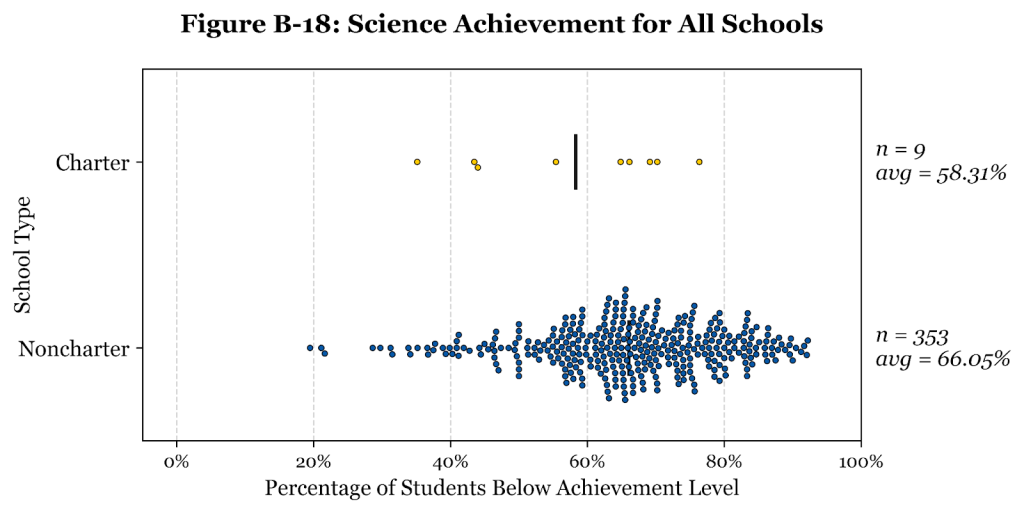
Figure B-18 compares the percentage of students below Science expectations at a given school to the type of school. Nine charter schools (Overman Academy did not have public Science data) and the 353 noncharter public schools with data were analyzed. The number of noncharter schools with science data is lower likely due to the infrequency of Science testing, as well as a lack of emphasis on Science testing in comparison to Math or English Language Arts. As with the English Language Arts, charter schools perform better than noncharter public schools in Science.
For Science, charter schools appeared to perform better for grades 3-6, 7-12, and 9-12 compared to noncharter public schools. For grades 3-8, charter schools performed within a percent of noncharter public schools. Noncharter public schools only outperformed charter schools in Science in schools serving grades 6-12; however, only one charter school was listed in this category. Moreover, charter schools outperformed noncharter public schools in the overall data, with a difference in averages of almost 8%.
Students with Disabilities
Next, we focused on how students with disabilities perform on tests in these subject areas at each school. This was done in part because charter schools had a slightly higher proportion of students with disabilities compared to noncharter public schools. The sample size of this data is much smaller for all sections since the MDOE redacts data if there aren’t enough students of a given demographic.
Math Performance

Figure B-19 displays the percentage of students with disabilities below state expectations in Math from charters serving grades 3-8 and noncharter public schools serving the same grade levels. Fiddlehead School of Arts & Math was the only charter school reporting data on students with disabilities, which had 72.73% of its students with disabilities below Math expectations. This was one percent less than the noncharter public school average of 73.85% and 4.78% below their median of 77.78% of students with disabilities below state expectations for Math.
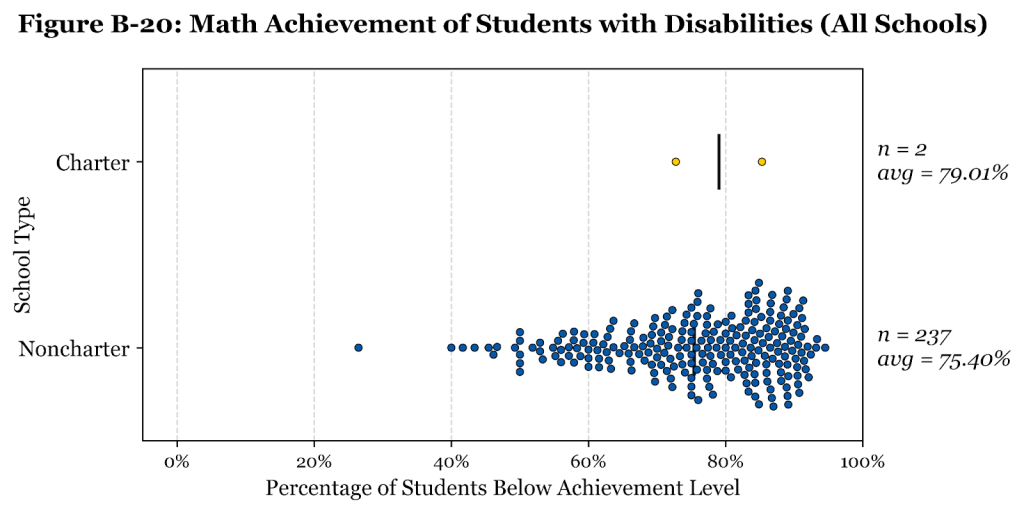
Figure B-20 below represents the percentage of students with disabilities below state expectations in Math for all charter schools and noncharter public schools reporting data. Fiddlehead School of Arts & Math and Maine Connections Academy were the two charter schools with data, which gave a mean of 79.01% and a median of 79% of their students below Math expectations. This was four percent more than the noncharter public school average of 75.40% and 1.58% above their median of 77.42% of students below state expectations for Math.
English Language Arts Performance

Figure B-21 shows the percentage of students with disabilities below state expectations in English Language Arts from charter schools serving grades 3-6 and noncharter public schools serving the same grades. Acadia Academy was the only charter school applicable, which saw 57.89% of its students below state expectations. This was better than the noncharter public school average of 68.33%, as well as the median for noncharter public schools of 69.44%.

Figure B-22 presents the percentage of students with disabilities below state expectations in English Language Arts from charter schools serving grades 3-8 and noncharter public schools serving the same grades. Dimensions Academy from Community Regional Charter School and Fiddlehead School of Arts & Science were the two 03-08 charter schools reporting data, which had a mean and median of 68.66% of its students with disabilities below state expectations. This was worse than the noncharter public school mean of 62.81% and median of 65.37% of students with disabilities below state expectations for English Language Arts.

Figure B-23 contrasts the percentage of students with disabilities below state expectations in English Language Arts from charters serving grades 7-12 and noncharter public schools serving the same grades. Maine Connections Academy and Maine Virtual Academy were the two charter schools reporting data at these grade levels, which had a mean and median of 62.56% of its students with disabilities below state expectations. On the contrary, noncharter public schools serving grades 7-12 had a greater mean percentage of students with disabilities below state expectations of 71.65%, and a greater median of 69.58%.
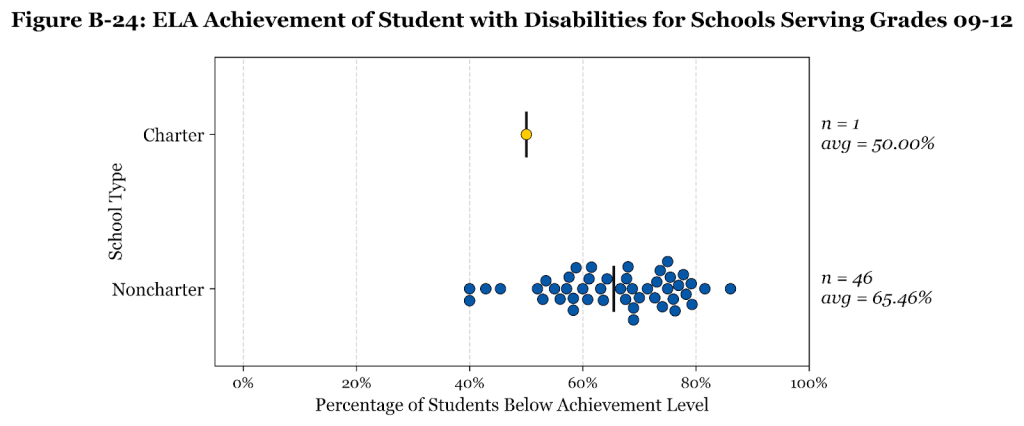
Figure B-24 reflects the percentage of students with disabilities below state expectations in English Language Arts from charter and noncharter public schools serving grades 9-12. Baxter Academy was the only charter school serving grades 9-12 which reported data, and they had 50.00% of their students with disabilities below state expectations. Noncharter public schools serving these grades had a larger mean percentage of students with disabilities below state expectations of 65.46% and a larger median of 67.66%.

Figure B-25 comprises the English Language Arts data on students with disabilities for all noncharter public schools and charter schools reporting data. The total number of noncharter schools is lower than in other analyses because the MDOE redacts data if there are not enough students of a given demographic to take the test. Students with disabilities at charter schools clearly outperform students with disabilities at noncharter public schools in English Language Arts. The median percentage of students with disabilities below state expectations for noncharter public schools is 66.37%, above the median for charter schools of 57.89%.
Science Performance

Figure B-26 illustrates the percentage of students with disabilities below state expectations in Science from charters and noncharter public schools serving grades 9-12. Maine Academy of Natural Sciences was the only charter school represented in the data, with 72.22% of students with disabilities below Science expectations. Noncharter public schools serving grades 9-12 had a lower mean percentage of students with disabilities below state expectations of 71.30% and a higher median of 80%.
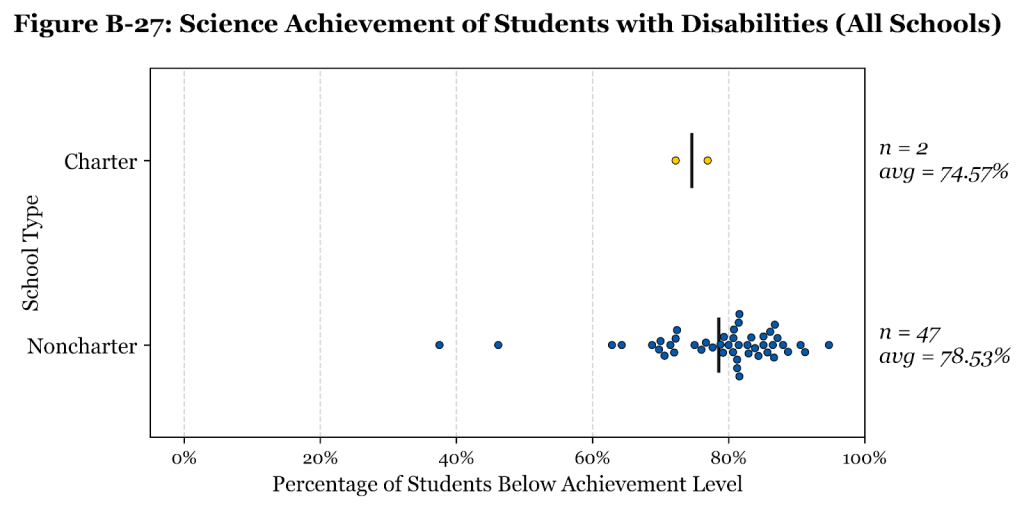
Figure B-27 demonstrates the percentage of students below state expectations in Science from all charters and noncharter public schools. Maine Academy of Natural Sciences and Maine Connections Academy, the two charter schools reporting data, had a mean and median percentage of students with disabilities below state expectations of 74.57%. Noncharter public schools had a higher mean percentage of students with disabilities below state expectations of 78.53% and a higher median of 81.25%.
For Math, charter schools performed worse overall in terms of the percentage of students with disabilities below state expectations. Contrarily, they performed better at the 3-8 grade level compared to noncharter public schools. For English Language Arts, charter schools outperformed noncharter public schools in the overall category. They also outperformed noncharter public schools in schools serving grades 3-6, 7-12, and 9-12. However, they performed worse in schools serving grades 3-8. For Science, charter schools performed similar to noncharter public schools serving grades 9-12 performed better overall in comparison to noncharter public schools.
It should be noted that charter schools disproportionately attract students that fail to flourish in traditional public schools. Thus, charter schools have higher rates of low-income and special education students than noncharter public schools. Once accounting for students with disabilities, charters performed noticeably better in English Language Arts and Science while being slightly behind in Mathematics. This highlights charter schools’ proficiency in accommodating students with disabilities in comparison to noncharter public schools.
C. Postsecondary Enrollment
Another standard used to review charter schools is postsecondary/college prep program offerings. However, the standard is not available for noncharter public schools, partially due to SAT, ASVAB, and Accuplacer participation rates not being published for most of these schools. The other reason is that postsecondary offerings like Advanced Placement courses aren’t measured for noncharter public schools.
Thus, we use the postsecondary enrollment rate standard to compare the percentage of students that go into a postsecondary program after graduating between noncharter public schools and charter schools. This is not the exact standard on which charter schools are judged, but it’s a relatively close and results-based standard. We use 2022-2023 data from 120 noncharter public schools and six Maine Charter schools for this analysis because these data lag a year behind other categories in data reporting. Less schools were available for both noncharter public and charter schools since only schools that serve students up to grade 12 report postsecondary enrollment rates.
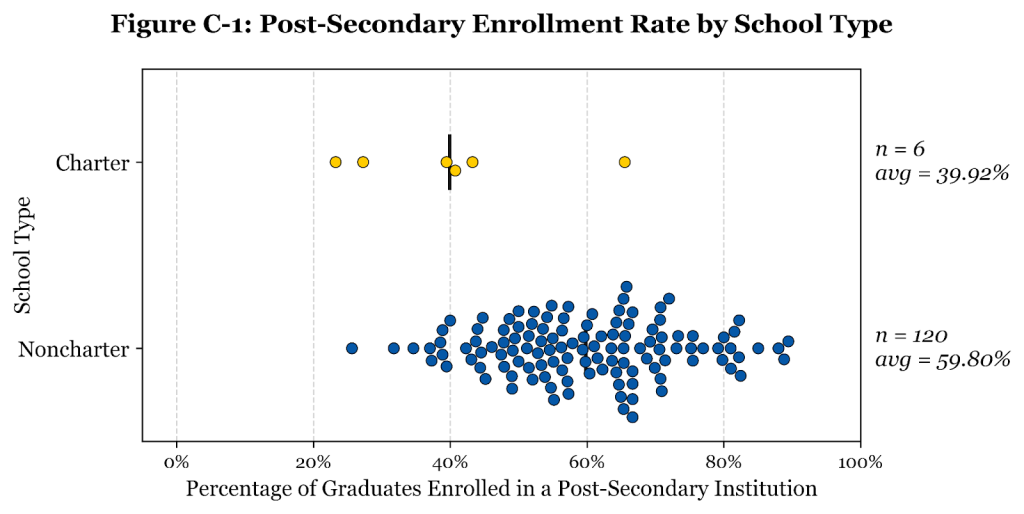
Figure C-1 clearly favors noncharter public schools. The average is over 20% higher for noncharter public schools (39.92% vs 59.80%). Moreover, the median noncharter public school has a postsecondary enrollment rate of 59.64%, greater than the median rate for charter schools of 35.64%. However, there are a variety of reasons for this. First, many of the charter schools are designed for students who don’t have postsecondary plans that would be counted under this standard (i.e., students attending the Ecology Learning Center to work on a farm).
In addition, nationwide data from a 2021 working paper from the National Bureau of Economic Research on the impact of school spending show that generally, for every $1,000 more in per-pupil spending, schools experience an average 2.65% increase in college enrollment. Based on the 21% inflation rate between the data’s adjusted inflation date (2018) and January 2023, this means we can expect a 2.65% increase in college enrollment rates for each $1,210 increase in per-pupil spending.
The median noncharter public school spends approximately $10,481 more per pupil than the median charter. Thus, based on these findings, we would expect an approximately 22.95% lower college enrollment rate for the median charter. But the actual gap is only 22.52%, meaning that charter schools actually outperform what would be expected based on spending by almost half a percent. Additionally, considering that many charter school students have alternative career goals, learning disabilities, low-income backgrounds, or poor historic academic performance, the fact that the postsecondary gap is actually higher than what is expected based on spending is even more of a good sign for charters. All of these demographics tend to have lower postsecondary enrollment already, thus an even larger gap should be expected.
Also of note is that most charter schools have higher rates of students from low-income backgrounds, and this group of students is already less likely to enroll in college. Additionally, since many of these students are those who do not fit in with traditional educational institutions, it is not surprising that many do not wish to enroll in college. A schoolwide postsecondary enrollment measurement can’t account for individual student goals, and rather assumes that all students should aim for postsecondary education. We should be careful not to penalize charter schools for attracting students from not-college-bound populations.
According to a report from the Center for Learning Equity, as of 2021, only 2.8% of Individuals with Disabilities Act (IDEA)-identified children attended Advanced Placement courses in noncharter public schools, while noncharter, non-IDEA students enrolled in AP classes at a rate of 20.9%. This shows that IDEA identified students disproportionately do not enroll in college prep courses, highlighting that charter schools which attract larger shares of these student populations may suffer from lower college placement rates as a result.
For income, a similar gap exists according to the Brookings Institution. High schoolers from the bottom socioeconomic quintile (fifth) of society had a 51% chance of going to college within 18 months of expected graduation, while high schoolers from the top quintile had an 89% chance.
Several of Maine’s charter schools have substantially higher low income percentiles than the average Maine school, in some cases 20% higher. Meanwhile the mean special education percentile at Maine’s charter schools is 25.5%, while statewide, only 19.5% of Maine students are labelled as needing special education services. This 6% increase could further account for this gap in college enrollment upon graduation.
In short, while charter schools do not perform at the same level as noncharters in postgraduate enrollment, their performance is either equivalent or better when accounting for funding and demographic differences.
The postsecondary enrollment standard is an indirect measure of postsecondary preparatory offerings and their successfulness, thus we only failed schools in this category that were the most egregiously behind. The worst postsecondary rate for a charter school was a 23.26% postsecondary enrollment rate for the Maine Academy of Natural Sciences (MeANS), and for this standard, we intended to fail only noncharters with a worse postsecondary enrollment rate than the worst charter school. However, MeANS is the school with the worst postsecondary enrollment rate in the state, largely for the reasons listed above.
MeANS in particular through their Threshold program caters to students that face challenges impeding their ability to flourish in traditional academic environments, and this further explains their status as an outlier. Because the school with the worst postsecondary enrollment rate in Maine is a charter school, no noncharter public schools will be considered as failing this standard.
D. Chronic Absenteeism
A student is generally considered chronically absent if they miss more than 10% of the school year. Charter schools are required to have chronic absenteeism rates of 18% or less to meet expectations. Between 18% and 25% is considered to be approaching expectations, similar to a “yellow light” for potential absenteeism problems. Any charter school with more than a 25% chronic absenteeism rate is considered failing to meet expectations.
In this section of the analysis, we also divide results by type of school and the grade levels served by charter schools and their noncharter public school equivalent.
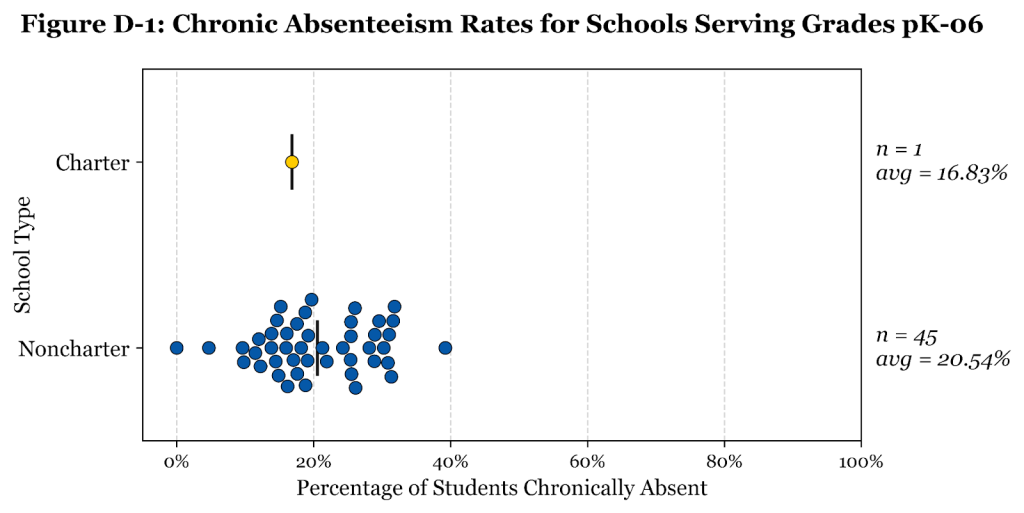
Figure D-1 illustrates the chronic absenteeism rate of charter and noncharter public schools serving grades pK-6. The only charter school that serves pK-6 was Acadia Academy, which had a 16.83% chronic absenteeism rate. Noncharter public schools serving pK-6 fared worse. They had a greater mean chronic absenteeism rate of 20.54%, and a greater median of 19.12%.

Figure D-2 depicts the chronic absenteeism rate of charter and noncharter public schools serving grades pK-8. The only charter school reporting data was Fiddlehead Center of Arts & Sciences, which had a 36.20% chronic absenteeism rate. Noncharter public schools serving grades pK-8 had a lower mean chronic absenteeism rate of 22.45%, and a lower median of 21.17%.
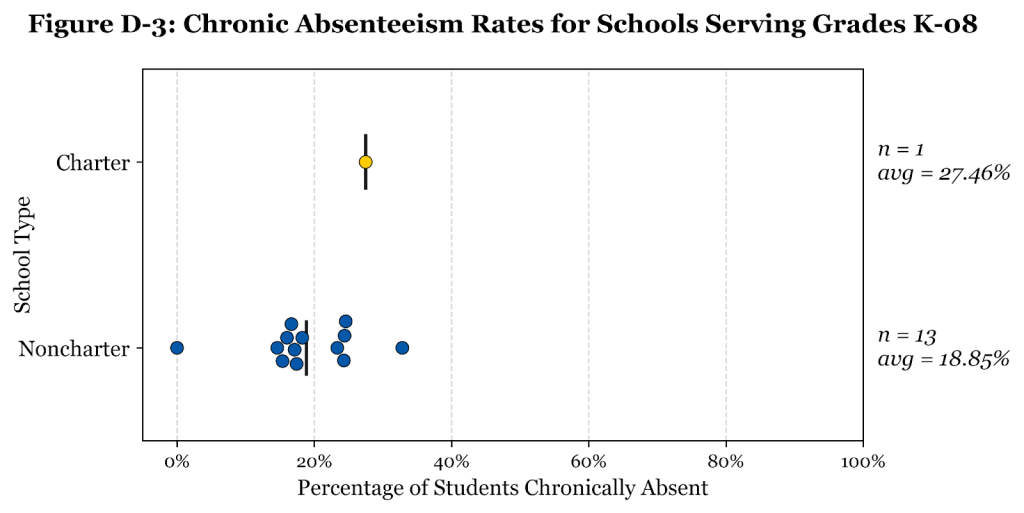
Figure D-3 represents the chronic absenteeism rate of charter and noncharter public schools serving grades K-8. The only charter school that served grades K-8 was Dimensions Academy of Community Regional Charter School, which had a 27.46% chronic absenteeism rate. Noncharter public schools serving grades K-8 outperformed Dimensions Academy, with a lower mean chronic absenteeism rate of 18.85%, and a lower median of 17.43%.

Figure D-4 demonstrates the chronic absenteeism rate of charters and noncharter public schools serving grades 6-12. The only charter school that served grades 6-12 was Overman Academy of Community Regional Charter School, which had a 43.13% chronic absenteeism rate. Noncharter public schools serving grades 6-12 had a lower mean chronic absenteeism rate of 29.78%, and a lower median of 28.45%.

Figure D-5 reflects the chronic absenteeism rate of charters and noncharter public schools serving grades 7-12. Maine Virtual Academy and Maine Connections Academy were the two charter schools serving these grade levels. They had a mean and median percentage of students chronically absent of 4.98%. Noncharter public schools serving 07-12 had a greater mean chronic absenteeism rate of 21.28%, and a greater median of 20.08%. It should be noted that both charters represented are virtual schools, which helps explain the far lower chronic absenteeism rate.

Figure D-6 portrays the chronic absenteeism rate of charters and noncharter public schools serving grades 9-12. Baxter Academy, Ecology Learning Center, Maine Academy of Natural Sciences, and the Maine Arts Academy School were the four charter schools represented. They had a mean percentage of students chronically absent of 24.82% and a median of 22.40%. Noncharter public schools serving these grades performed worse. They had a greater mean chronic absenteeism rate of 31.33% and a greater median of 30.88%.
Charter schools had lower chronic absenteeism rates in grade levels of pK-6, 7-12, and 9-12 while noncharter public schools had lower chronic absenteeism rates at the grade levels of pK-8, K-8, and 6-12. Based on the data for the various grade levels, charter schools and noncharter public schools appear to be on par in terms of chronic absenteeism rates.
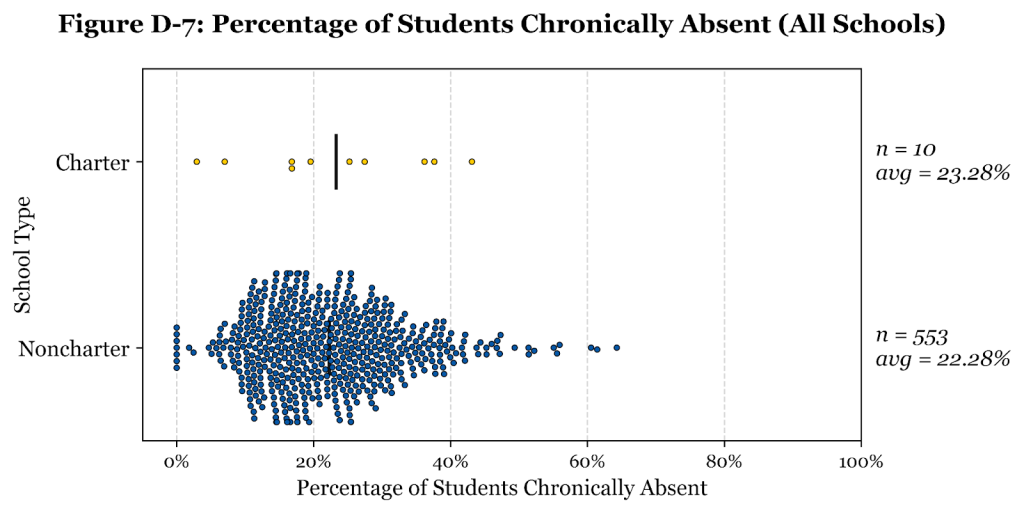
Figure D-7 displays the chronic absenteeism rate for every charter and noncharter public school in Maine. The median for charter schools is only slightly higher than that of noncharter public schools (22.4% compared to 20.86%). The mean chronic absenteeism rate across charter schools is 23.28%, one percent more than the 22.28% mean of noncharter public schools.
Although noncharter public schools seem to outperform charter schools in chronic absenteeism, it isn’t by much. Fifty percent of the current charter schools are failing expectations (five out of ten). On the contrary, 203 of the 553 noncharter public schools would be failing expectations, or 36.71%. Moreover, only one charter school falls under the “approaching expectations” standard. Meanwhile, 130 noncharter public schools, or 23.51%, would be defined as approaching expectations under the chronic absenteeism standard set for charter schools.
In total, 60.22% of noncharter public schools would be considered as not “meeting expectations” for absenteeism, close to the three-fifths of charter schools which do not meet the expectation, either. Furthermore, Harpswell Coastal Academy was shut down in part due to high chronic absenteeism rates. The most recent absenteeism rate of Harpswell before their closure was 46.8%. Fourteen noncharter public schools had an equal or greater rate of chronic absenteeism, or roughly 2.53% of noncharter public schools.
Even though charter schools are slightly worse than noncharter public schools in chronic absenteeism rates, their distributions under this standard are quite similar. While no charter school has been shut down solely due to chronic absenteeism, it is a standard that can be considered in school shutdowns, and it was one of the three factors that led to the closure of Harpswell Coastal Academy.
E. Campus Safety
For charter schools in Maine, school safety is assessed in a few different ways. The primary method (the one that is reported in each school’s annual monitoring report) is exit surveys given to families and students. Noncharter public schools are not required to take these surveys, however, and so for the purposes of this analysis, we relied on a different standard: the rate of behavioral incidents relative to the size of the student body.
Behavioral incidents fall under the following categories in the Maine school system: alcohol related, illicit drug-related, violent incident (with physical injury), violent incident (without physical injury), weapons possession, and other reasons for removal not related to drug use. This is not the same as an exit survey-based standard, but since it is based on actual incidents rather than mere feelings of safety, it is in many ways more objective.
A total of 486 charter and noncharter public schools reported behavioral incident data, including four of the 10 charter schools. However, in this section we again try only to compare noncharter schools to similar charters schools, especially in relation to grade ranges. We expect kindergarteners, for example, to have much lower rates of behavioral incidents than high schoolers, and indeed they do. Each of the four charter schools that reported behavioral incidents data was a high school, and when we compare their average incidence rate with noncharter public high schools, we find that charter schools perform better.
In our analysis, we analyzed the incident rates at the four reporting charter schools and labelled any noncharter program with a higher incident rate than that of the most incident prone charter school as failing our campus safety standard. In 2024, the charter school with the highest incident rate was the Maine Academy of Natural Sciences, at 0.2113 incidents per student.
Of all noncharter public high schools which reported data (the more comparable group, as highlighted above), 20.73% (17 schools) had an incident rate higher than the Maine Academy of Natural Sciences. If noncharter public schools serving grades outside of grades 9-12 and were accounted for in this analysis, 8.92%, an additional 26 schools, would have a total incident rate higher than 0.2113 incidents per student.
We should note that while a survey is likely a worthwhile way of assessing students’ general sense of safety at school, this kind of qualitative variable is only one part of the picture. Safety at school is a phenomenon that bears a strong relationship to hard, quantitative variables like behavioral incidents. While this kind of data is not perfect, it does serve to fill out the picture and is less subjective than the standard actually used by the charter commission.
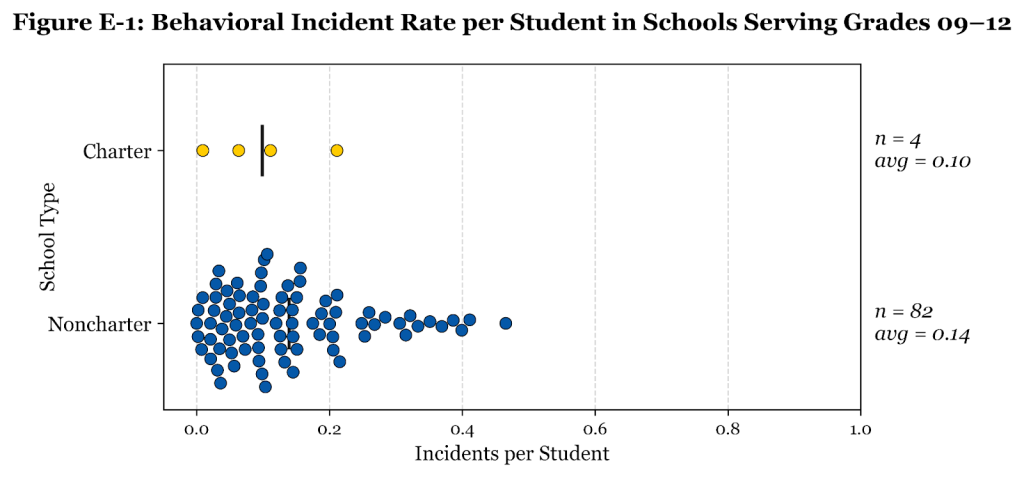
Figure E-1 illustrates the comparison in behavioral incident rates between charters and noncharter public schools serving grades 9-12. The general trend between charters and noncharter public high schools is that charter schools seem to perform better, but noncharter public high schools are still comparable. Charter schools averaged 0.10 incidents per student and noncharter public high schools averaged 0.14 incidents per student. Moreover, charter schools had a lower median of 0.087 incidents per student in comparison to the median of 0.105 incidents per student for noncharter public high schools. In summary, charter high schools seem to be safer than noncharters, though this difference is slight to moderate.
F. Financial Efficiency
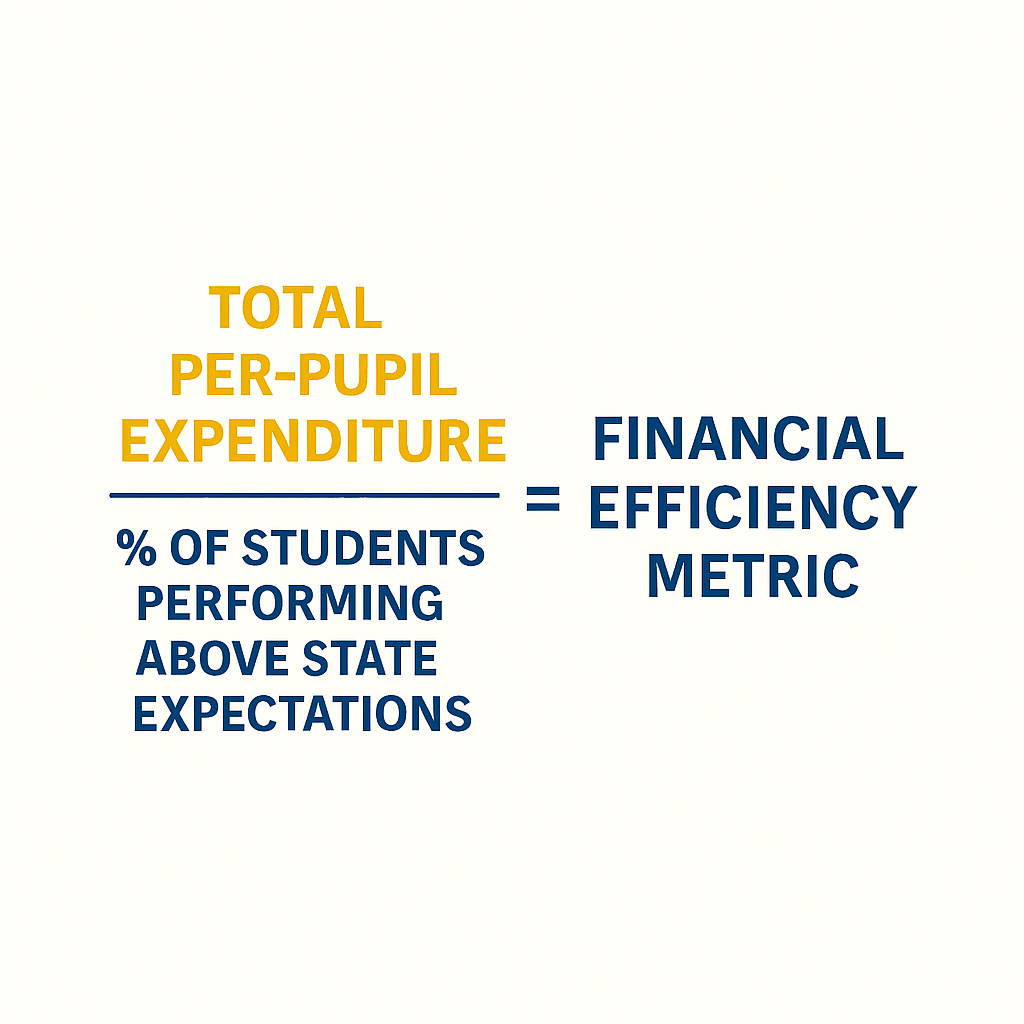
As previously noted, the data required to assess and compare charters and noncharter public high schools on financial efficiency requires data on noncharter schools that is not publicly available. To overcome this, we analyzed schools on the following standard: total per-pupil spending divided by the percent of students above expectations on a given state examination. Total per-pupil spending was calculated by taking the total expenditures of a given school and dividing it by the number of students enrolled in the school. Put simply, this standard assesses the amount of spending it took to get a student above achievement level.
For example, if a school spent $15,000 total per pupil and 50% of their student body was above achievement level on the Math test, their score on the standard would be $15,000 divided by 0.50, or $30,000. That is, the school on average had to spend $30,000 in order to successfully get one student above the expectations for math performance. While simple, this standard succeeds at portraying how efficiently a school is using its resources to achieve positive student learning outcomes. This standard is designed to avoid equating a school that spends little to get poor outcomes with a school that spends more to get better outcomes.
It is worth noting that the Maine Department of Education total per-pupil spending data needed to establish this standard were poorly recorded and formatted. First, the school names were not drawn from the 2023-2024 list of Maine schools. Rather, they seemed to match up best with the list provided for the 2022-2023 school year. There were a few schools which had changed their names, but the bulk of discrepancies between the two lists were due to lazy shorthand in the 2022-2023 list (e.g. “Sch” for “School”).
Second, we identified 30 duplicate rows in the data set. Finally, some schools reported zero dollars in total per-pupil spending. To the best of our knowledge, this is due to the minutiae of how funding is distributed to schools in unorganized territories (otherwise these schools would be phenomenal examples of financial efficiency). Regardless, those schools were excluded from this analysis.
We were able to generate a score on at least one of the testing subjects for 505 Maine schools, with 10 of those being charter schools (both measured Community Charter School programs being counted separately as done previously).
Four-hundred ninety-nine of the schools that reported total per-pupil spending also had published and unredacted Math test outcomes. For English Language Arts outcomes, the number of schools was 500, and for Science outcomes, it was 353. Figures F-1 through F-18 show the scores on our financial efficiency standard by school type and grade level.
As with our academic performance standard, schools were grouped by the grades which are assessed on the statewide tests. For example, since assessment begins in third grade, schools which serve kindergarten through sixth grade were grouped in with schools that serve grades three through six. Grade levels that didn’t include a charter school were only included in the overall analysis for each subject area assessed.
Schools were considered to be failing this standard if they had a higher cost per successful student outcome than the worst performing charter school in a given subject in two or more academic subjects. Schools were only included in the total number the financial efficiency standard if they had data on two or more subjects and total per-pupil spending.
In total, 232 noncharter public schools failed under this standard out of 485 total schools (47.84% of measured schools). This was by far the category where the most noncharter public schools failed, which is ironic given that financial efficiency was one of the three main reasons Harpswell Coastal Academy was closed down.
Math
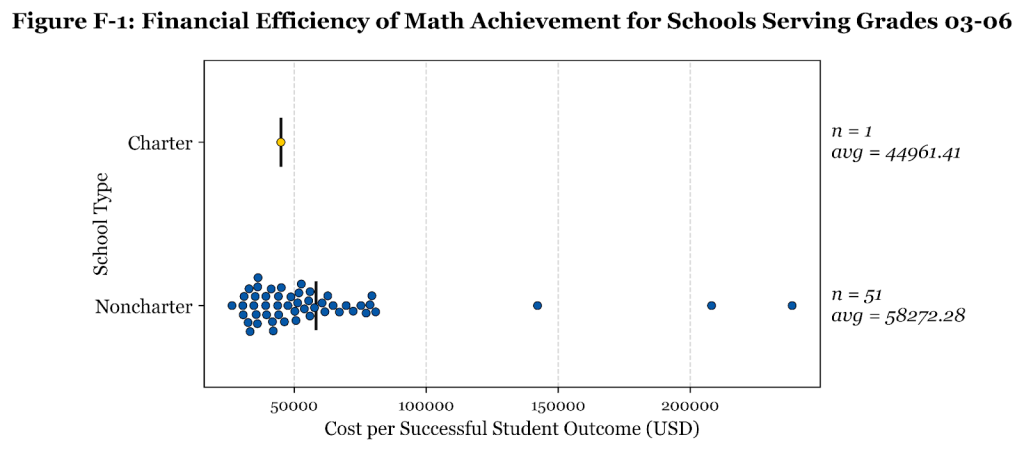
Figure F-1 depicts the cost per successful student outcome in Math among charters and noncharter public schools serving grades 3-6. Acadia Academy was the sole charter school represented, which had a cost per successful student outcome in Math of $44,961.41. Noncharter public schools performed far worse, with a mean cost per successful student outcome in Math of $58,272.28 and a median of $48,812.71.

Figure F-2 illustrates the cost per successful student outcome in Math for charters and noncharter public schools serving grades 3-8. Dimensions Academy of Community Regional Charter School and Fiddlehead School of Arts & Science were the two charter schools included in this analysis, which had a mean and median cost per successful student outcome in Math of $38,347.16. Noncharter public schools in the 03-08 grade span clearly performed worse, with a mean cost per successful student outcome in Math of $67,918.05 and a median of $53,615.23.
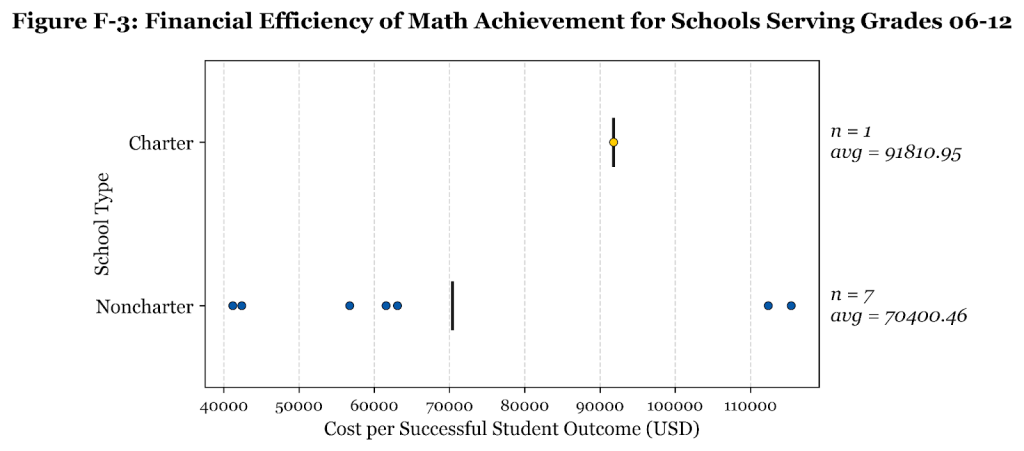
Figure F-3 portrays the cost per successful student outcome in Math for charter and noncharter public schools serving grades 6-12. Overman Academy of Community Regional Charter School was the only charter school included, which had a cost per successful student outcome in Math of $91,810.85. Noncharter public schools serving grades 6-12 had a lower mean cost per successful student outcome in Math of $70,400.46 and a lower median of $61,574.97. The size of these scores is due to the relatively small percentage of students scoring above achievement level at these schools.
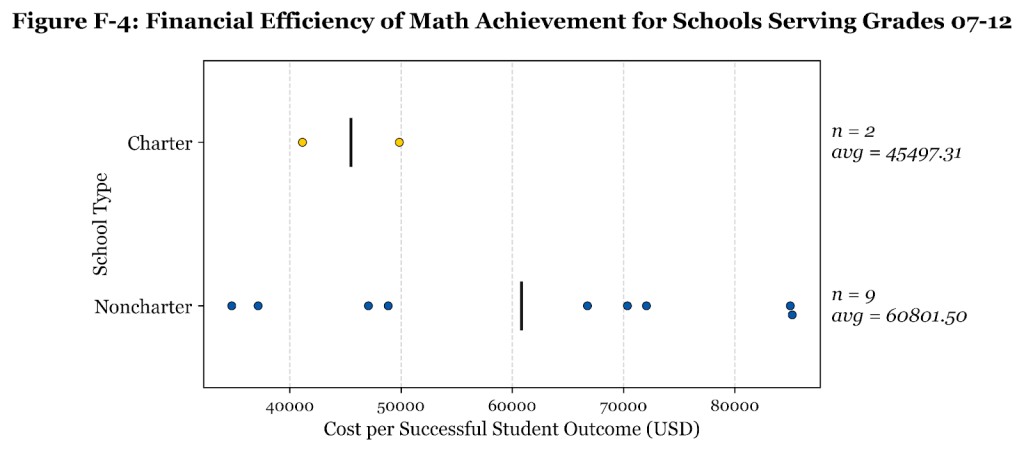
Figure F-4 reflects the cost per successful student outcome in Math for charter and noncharter public schools serving grades 7-12. The two charter schools represented were Maine Connections Academy and Maine Virtual Academy, which had a mean and median cost per successful student outcome in Math of $45,497.31. Noncharter public schools serving grades 7-12 had a median cost per successful student outcome in Math of $66,760.06 and a mean of $60,801.50.
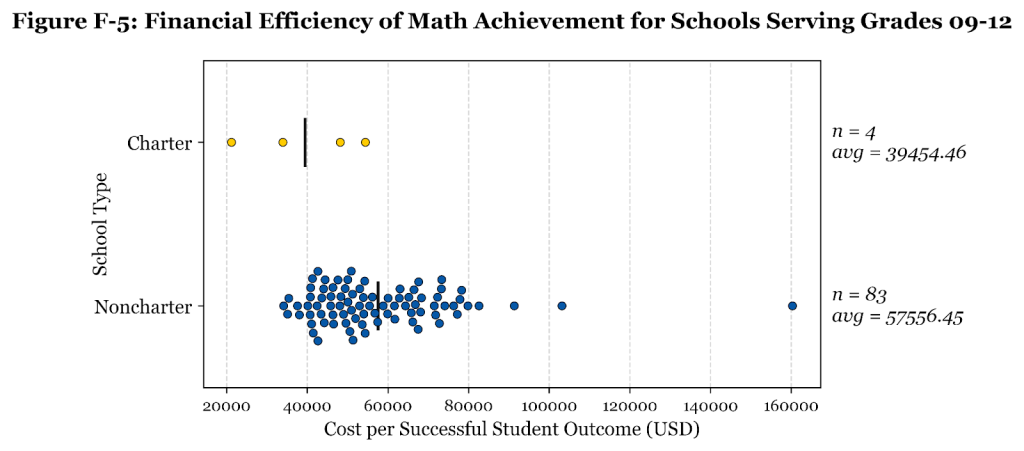
Figure F-5 represents the cost per successful student outcome in Math for charter and noncharter public schools serving grades 9-12. The four charter schools represented were Baxter Academy, Ecology Learning Center, Maine Academy of Natural Sciences, and Maine Arts Academy School. They had a mean cost per successful student outcome in Math of $39,454.46 and a median of $41,083.61. Noncharter public schools serving grades 9-12 performed worse, having a median cost per successful student outcome in Math of $53,649.96 and a mean of $57,556.45.
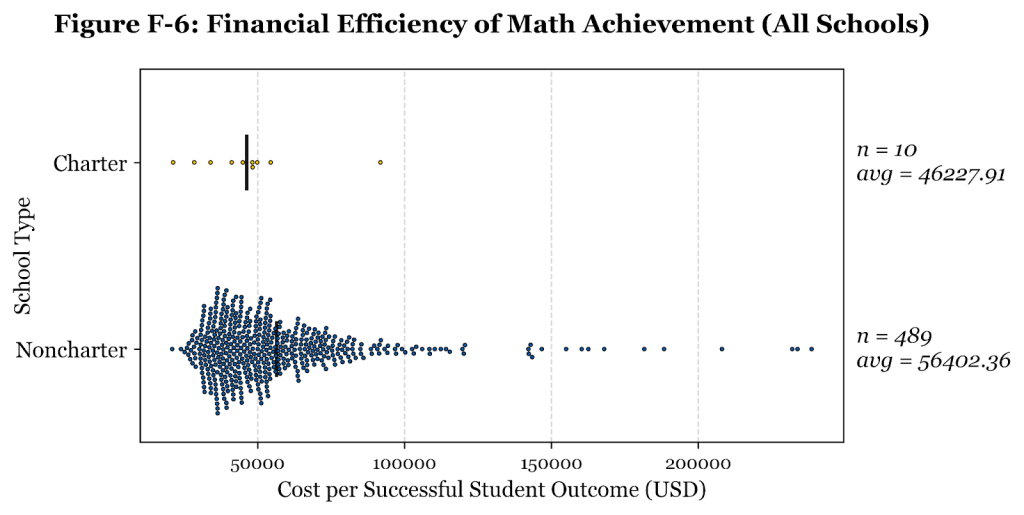
Figure F-6 shows the cost per successful student outcome in Math for all schools. The 10 charter schools with data had a median cost per successful student outcome in Math of $46,581.50 and a mean of $46,227.91. Noncharter public schools did notably worse on average, where they had a median cost per successful student outcome in Math of $49,408.35 and a mean of $56,402.36.
English Language Arts
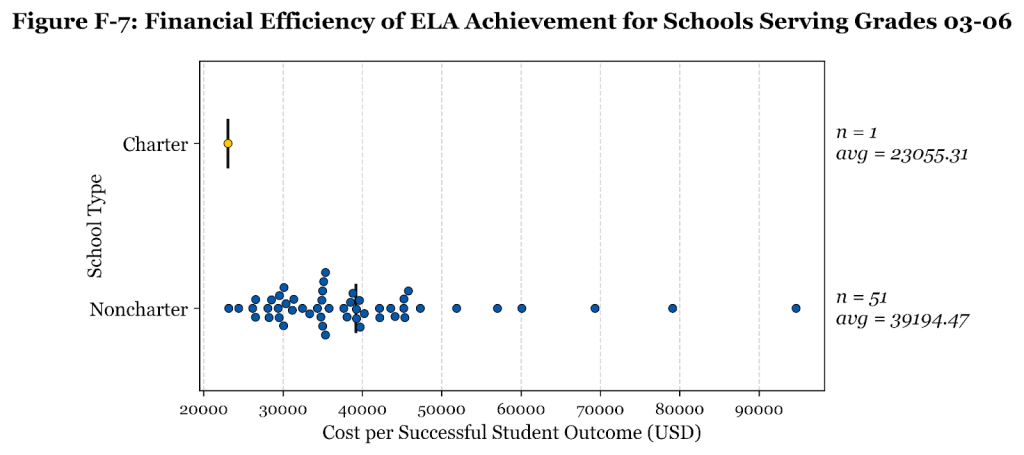
Figure F-7 demonstrates the cost per successful student outcome in English Language Arts for charter and noncharter public schools serving grades 3-6. Acadia Academy was the sole charter school represented, which had a cost per successful student outcome in English Language Arts of $23,055.31. Noncharter public schools performed worse, with a mean cost per successful student outcome in English Language Arts of $39,194.47 and a median of $35,354.71.

Figure F-8 displays the cost per successful student outcome in English Language Arts for charters and noncharter public schools serving grades 3-8. Dimensions Academy of Community Regional Charter School and Fiddlehead School of Arts & Science were the two charter schools represented, which had a mean and median cost per successful student outcome in English Language Arts of $23,392.98. Noncharter public schools did not fare as well, with a mean cost per successful student outcome in English Language Arts of $45,489.28 and a median of $38,375.97.

Figure F-9 depicts the cost per successful student outcome in English Language Arts for charter and noncharter public schools serving grades 6-12. Overman Academy of Community Regional Charter School was the only charter school included, which had a cost per successful student outcome in English Language Arts of $24,295.98. Noncharter public schools had a mean cost per successful student outcome in English Language Arts of $37,487.40 and a median of $31,314.95.

Figure F-10 illustrates the cost per successful student outcome in English Language Arts for schools serving grades 7-12. The two charter schools represented were Maine Connections Academy and Maine Virtual Academy, which had a mean and median cost per successful student outcome in English Language Arts of $17,465.85. Noncharter public schools serving grades 7-12 had a median cost per successful student outcome in English Language Arts of $34,752.52 and a mean of $33,995.34. The charter school mean was just over half of the mean for noncharter public schools, and the median was also slightly more than half of the noncharter public school median.
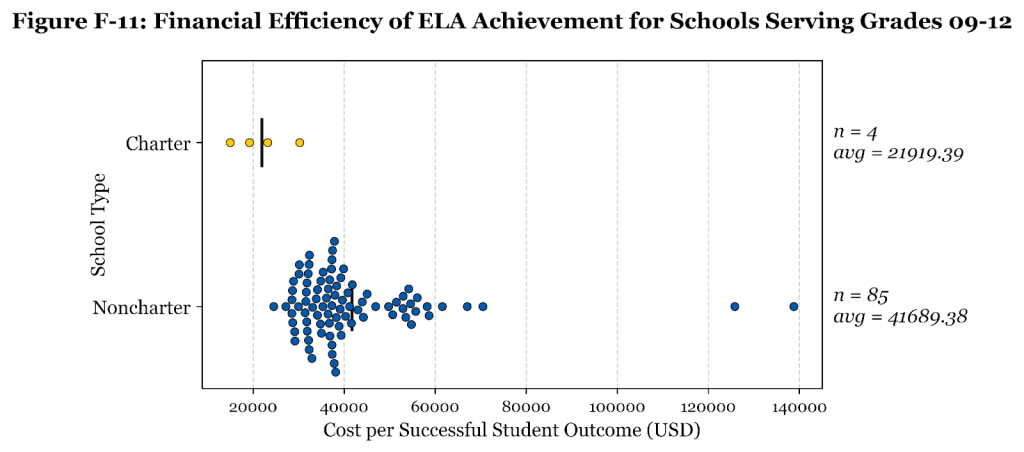
Figure F-11 portrays the cost per successful student outcome in English Language Arts charter and noncharter public schools serving grades 9-12. The four charter schools represented were Baxter Academy, Ecology Learning Center, Maine Academy of Natural Sciences, and Maine Arts Academy School. They had a median cost per successful student outcome in English Language Arts of $21,220.83 and a mean of $21,919.39. Noncharter public schools performed worse, having a median cost per successful student outcome in English Language Arts of $37,638.33 and a mean of $41,689.38.

Figure F-12 reflects the cost per successful student outcome in English Language Arts for all charter and noncharter public schools. The 10 charter schools with data had a mean cost per successful student outcome in English Language Arts of $21,674.65 and a median of $22,807.25. Noncharter public schools did considerably worse, having a median cost per successful student outcome in English Language Arts of $36,016.46. Furthermore, the mean cost per successful student outcome in English Language Arts for noncharter public schools was $39,579.31, $17,904.66 more than the charter school mean.
Science

Figure F-13 represents the cost per successful student outcome in Science for schools serving grades 3-6. Acadia Academy was the sole charter school represented, which had a cost per successful student outcome in Science of $28,670.93. Noncharter public schools by far performed worse, with a mean cost per successful student outcome in Science of $121,571.33 and a median of $112,795.20. The mean was over four times higher for noncharter public schools while the median was well over three times the median of charter schools.
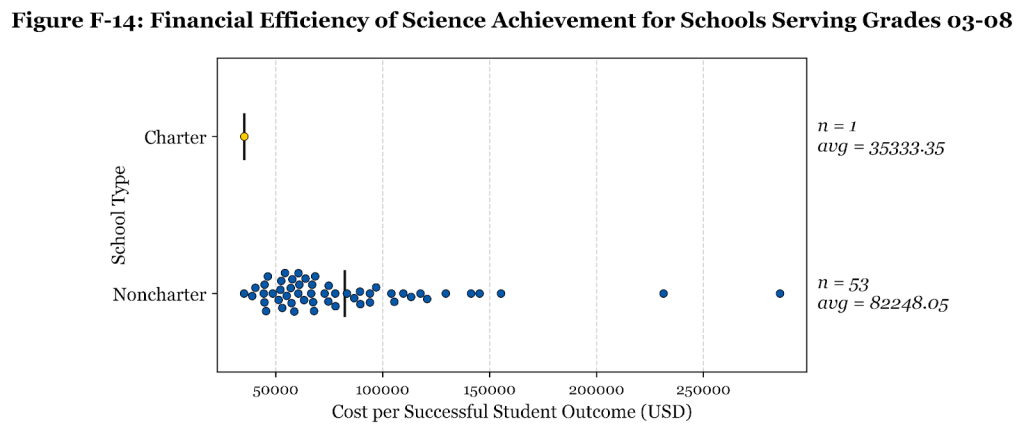
Figure F-14 shows the cost per successful student outcome in Science for charters and noncharter public schools serving grades 3-8. Fiddlehead School of Arts & Science was the only charter school represented, which had a cost per successful student outcome in Science of $35,333.35. Noncharter public schools performed worse, with a mean cost per successful student outcome in Science of $82,248.05 and a median of $67,506.65. Both the mean and median for noncharter public schools were more than $30,000 higher for success in Science than the lone charter school serving students at these grade levels.

Figure F-15 displays the cost per successful student outcome in Science for schools serving grades 6-12. Overman Academy of Community Regional Charter School was the only charter school represented, which had a cost per successful student outcome in Science of $52,158.25. Noncharter public schools had a mean cost per successful student outcome in Science of $78,991.95 and a median of $71,911.59, both worse in comparison to Overman Academy.
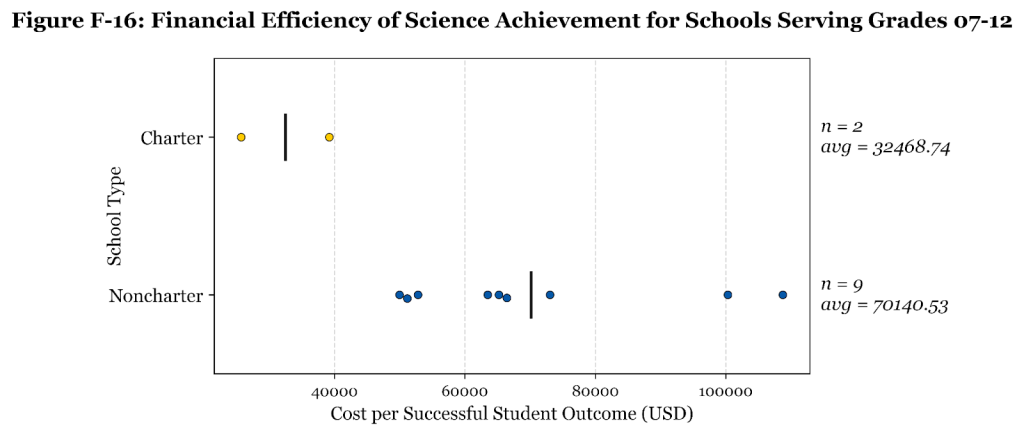
Figure F-16 depicts the cost per successful student outcome in Science for charter and noncharter public schools serving grades 7-12. The two charter schools represented were Maine Connections Academy and Maine Virtual Academy, which had a mean and median cost per successful student outcome in Science of $32,468.74. Noncharter public schools serving grades 7-12 had a median cost per successful student outcome in Science of $65,218.60 and a mean of $70,140.53, more than double the mean for charter schools.
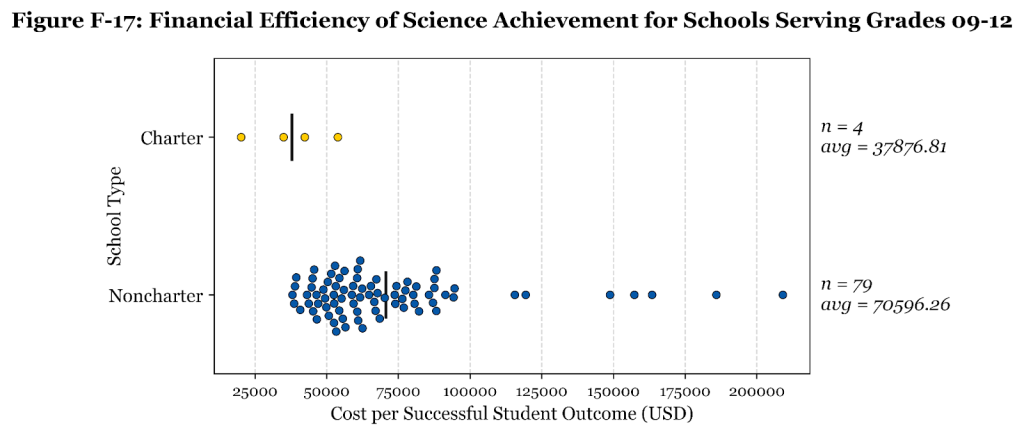
Figure F-17 illustrates the cost per successful student outcome in Science for the charter and noncharter public schools serving grades 9-12. The four charter schools represented were Baxter Academy, Ecology Learning Center, Maine Academy of Natural Sciences, and Maine Arts Academy School. They had a median cost per successful student outcome in Science of $38,687.69 and a mean of $37,876.81. Noncharter public schools performed worse, where they had a median cost per successful student outcome in Science of $61,000.70 and a mean of $70,596.26.

Figure F-18 portrays the cost per successful student outcome in Science for all schools. The nine charter schools with data had a median cost per successful student outcome in Science of $35,333.35 and a mean of $36,956.36. Noncharter public schools performed considerably worse, where they had a median cost per successful student outcome in Science of $68,506.85, $33,173.50 more than the median for charter schools. Moreover, the mean for noncharter public schools of $84,033.64 was also more than double the mean for charter schools.
Charter schools excel in this standard. As can be seen in the graphs, the most efficient school is almost always a charter school. In addition, the worst charter school in English Language Arts and Science performs better than the average non charter public school. Both the mean and median charter schools outperformed the mean and median noncharter public schools, highlighting the stronger performance of charter schools in every single comparison except in Math performance for schools serving grades 6-12. the 06-12 grade span in Math.
Charter schools perform worse academically in math, however they do much more per dollar than most Maine noncharter schools. If Maine was looking to most effectively improve education outcomes with education spending, they would be better off giving state dollars to charters than noncharter schools.
G. Achievement Gaps
Achievement gaps are one of the more obscure standards under which the Commission evaluates charter schools. Although it sometimes isn’t listed as a requirement in the overall annual report, or in the individual annual reports from the Commission, it was one of the standards used to evaluate Harpswell Coastal Academy before it was shut down. In addition, the part of the Maine Regulatory Code where the Charter School Commission establishes its performance indicators for charter review frameworks explicitly requires these frameworks to be based on, in part, achievement gaps.
Before it was closed, Harpswell had to provide evidence of closing or keeping closed identified achievement gaps of major demographic subgroups. However, it’s worth noting that failure to close achievement gaps was not one of the reasons used to close the school–it was simply a metric used to evaluate the school prior to its closure. The demographics measured include English language learners, special education, gender, economically disadvantaged, ethnic minorities, and racial minority students.
The standard we used to measure achievement gaps of different demographics began with taking the performance difference of students at or above achievement level within a given demographic group and the students not in the group, and then analyzing the differences between these gaps for the 2020-21 and 2023-24 school years. If the gap increases over this period, then one specific subgroup of students are doing worse than the others over time, indicating a growing achievement gap.

Although a variety of demographics should be examined for demographic achievement gaps, only three had enough data for accurate conclusions. For this reason, we examine only economically disadvantaged vs. non-economically disadvantaged, female vs. male, and students with disabilities vs. students without disabilities. Additionally, there is not enough data on all charters to perform this analysis, meaning we only examine noncharter public schools in this section.
According to our analysis of the data, the achievement gaps in noncharter public schools generally worsened. In the data below, positive percentages mean that, since the 2020-2021 school year, the gap between the two demographics has increased by that percentile. Negative numbers represent a narrowing of the gap, while schools that reversed their gap were ignored.
The median percentage difference for economically disadvantaged vs. non-economically disadvantaged students was 4.28% for English Language Arts and 3.88% for Math, indicating a growing achievement gap. In the female vs. male standard, the median percentage difference was -2.12% for English Language Arts and 4.29% for Math. Among students with disabilities vs. students without disabilities standard, the median percentage difference was 1.96% for English Language Arts and -1.22% for Math. These data suggests that achievement gaps generally grew over the period between the school years 2020-2021 and 2023-2024.
Since there is no set criteria in the standard to measure what the Commission considers to be poor achievement gaps, we used the 1.5 IQR (interquartile range) potential outliers test to evaluate if a noncharter public school would fail under this requirement. This test uses the interquartile range(IQR), or the middle 50% of the data. The IQR is multiplied by 1.5 and added to the third quartile and subtracted from the first, giving a range. Any data points which lie outside of this range are considered outliers. For the purposes of this standard, we only examined the schools which were upper outliers, i.e. whose gaps had grown over that period, except for male vs. female comparisons, since both sexes were considered relevant demographics.
In the economically disadvantaged vs. non economically disadvantaged substandard, three schools failed on English Language Arts and two schools failed on Math, with no school failing both. In the female vs. male substandard, 11 schools failed on English Language Arts and 10 schools failed on Math. In the subgroup of students with disabilities vs. students without disabilities, zero schools failed on English Language Arts and one school failed on Math.
In total, 24 unique schools failed at least English Language Arts or Math in one of the subgroups. Additionally, three of the 24 schools failed both English Language Arts and Math in the female vs. male subgroup. Broken down by subject, 14 schools failed on English Language Arts out of 285 with data (4.91%), and 13 schools failed on Math out of 300 with data (4.33%). Overall, 24 unique schools out of the 326 unique schools that listed some data failed at least once (7.36%).
Based on these data, it’s also likely that more schools would fail if there were sufficient data on the other demographics, such as English language learners, ethnicity, or race. Even without this, 24 schools were considered to be failing using a high standard for achievement gaps. This highlights just how overbearing some of these requirements are for charter schools–many noncharter public schools would be unable to meet the same standard expectations even with much greater levels of funding.